Introduction to X Introduction to X- -ray crystallography ray - - PDF document

introduction to x introduction to x ray crystallography
SMART_READER_LITE
LIVE PREVIEW

Introduction to X Introduction to X- -ray crystallography ray - - PDF document

1 1 Structure Bioinformatics Course Basel 2004 Basel 2004 Structure Bioinformatics Course Introduction to X Introduction to X- -ray crystallography ray crystallography Sergei V. Strelkov M.E. Mueller Institute M.E.


slide-1
SLIDE 1

1

1 1

Structure Bioinformatics Course Structure Bioinformatics Course – – Basel 2004 Basel 2004

Introduction to X Introduction to X-

  • ray crystallography

ray crystallography

Sergei V. Strelkov Sergei V. Strelkov – – M.E. Mueller Institute M.E. Mueller Institute for Structural Biology at Biozentrum Basel for Structural Biology at Biozentrum Basel sergei sergei-

  • v.strelkov@unibas.ch

v.strelkov@unibas.ch

2 2

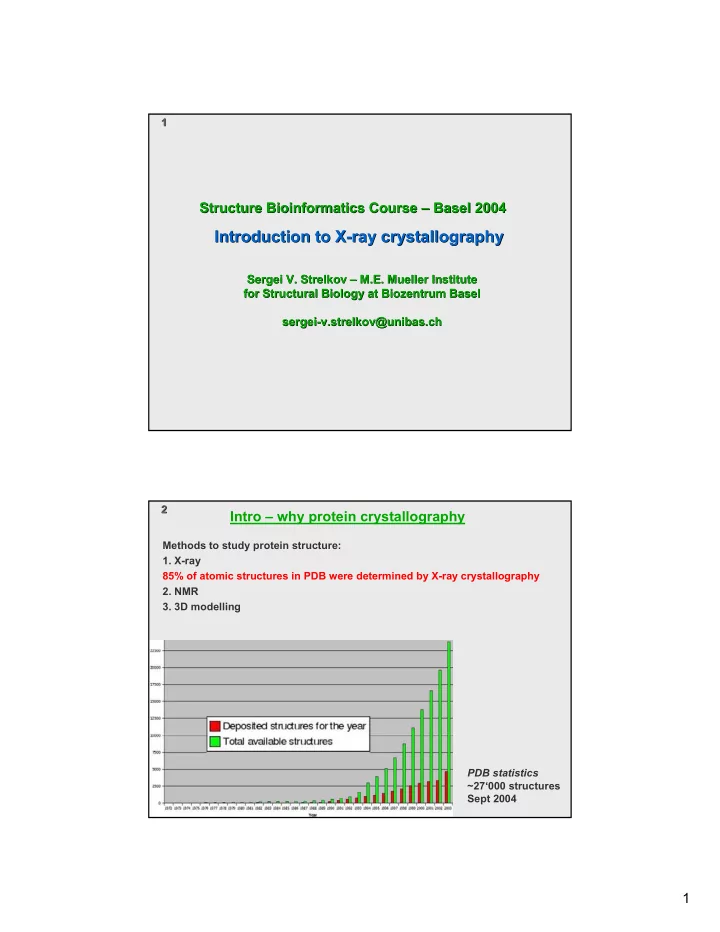
Intro – why protein crystallography

Methods to study protein structure:

  • 1. X-ray

85% of atomic structures in PDB were determined by X-ray crystallography

  • 2. NMR
  • 3. 3D modelling

PDB statistics ~27‘000 structures Sept 2004

slide-2
SLIDE 2

2

3 3

Glusker and Trueblood

Microscope vs X-ray diffraction

same principle, no lenses 4 4

  • 1. Why X-rays?

Dimensions:

  • Chemical bond ~1 Å (C-C bond 1.5 Å)
  • Protein domain ~50 Å
  • Ribosome ~250 Å
  • Icosahedral virus ~700 Å

Wavelengths:

  • Visible light λ = 200 - 800 nm
  • X-rays λ = 0.6 - 3 Å
  • Thermal neurons λ = 2 - 3 Å
  • Electron beam λ = 0.04 Å (50 keV electron microscope)
  • 2. Why crystals?

to be answered later…

slide-3
SLIDE 3

3

5 5

Four steps to a crystal structure Å

Protein purification

(usually after cloning/recombinant expression) 6 6

What you get – a PDB file

... ATOM 216 N ARG D 351 4.388 68.438 23.137 1.00 43.02 ATOM 217 CA ARG D 351 4.543 69.520 22.185 1.00 44.67 ATOM 218 CB ARG D 351 4.967 69.042 20.821 1.00 44.90 ATOM 219 CG ARG D 351 6.398 68.654 20.761 1.00 51.64 ATOM 220 CD ARG D 351 6.868 68.340 19.302 1.00 63.98 ATOM 221 NE ARG D 351 7.166 66.901 19.052 1.00 73.04 ATOM 222 CZ ARG D 351 6.372 66.035 18.349 1.00 76.38 ATOM 223 NH1 ARG D 351 5.205 66.430 17.818 1.00 75.53 ATOM 224 NH2 ARG D 351 6.754 64.767 18.165 1.00 75.80 ATOM 225 C ARG D 351 3.271 70.311 22.056 1.00 44.67 ATOM 226 O ARG D 351 3.326 71.535 21.975 1.00 44.20 ATOM 227 N MET D 352 2.145 69.620 22.040 1.00 43.72 ATOM 228 CA MET D 352 0.880 70.278 21.909 1.00 45.59 ATOM 229 CB AMET D 352 -0.260 69.244 21.726 0.50 44.00 ATOM 230 CB BMET D 352 -0.337 69.338 21.761 0.50 44.14 ATOM 231 CG AMET D 352 -0.395 68.734 20.260 0.50 45.54 ATOM 232 CG BMET D 352 -1.699 70.119 21.628 0.50 47.21 ATOM 233 SD AMET D 352 -1.370 67.186 19.986 0.50 51.17 ATOM 234 SD BMET D 352 -1.768 71.563 20.386 0.50 50.67 ATOM 235 CE AMET D 352 -2.900 67.856 19.848 0.50 46.38 ATOM 236 CE BMET D 352 -3.556 71.823 20.152 0.50 50.17 ATOM 237 C MET D 352 0.646 71.204 23.118 1.00 46.70 ATOM 238 O MET D 352 0.276 72.366 22.923 1.00 49.10 ... ATOM 532 O HOH W 4 2.840 93.717 24.656 1.00 34.14 ATOM 533 O HOH W 5 -6.598 98.596 19.494 1.00 37.63 ATOM 534 O HOH W 7 3.016 64.018 27.662 1.00 49.04 ATOM 535 O HOH W 8 4.775 77.762 16.985 1.00 56.39 ...

slide-4
SLIDE 4

4

7 7

X-ray vs NMR vs Simulation

15% of protein structures are determined by NMR, 75% of these proteins were never crystallised

S t r u c t u r e Dynamics NMR X-Ray

Time scale

Simulation native unfolded

s ms µs ns 100 1000

Number of residues

8 8

Protein crystallography

Advantages:

  • Is the technique to obtain an atomic resolution structure
  • Yields the correct atomic structure in solution

Caveat: is the structure in crystal the same as in solution? Yes!

  • Atomic structure is a huge amount of data compared to what any other

biochemical/biophysical technique could provide

  • > This is why X-ray structures get to Cell and Nature…

Disadvantages:

  • Needs crystals
  • Is laborous in any case:

cloning/purification 3-6 months per structure crystallisation 1-12 months data collection 1 month phasing/structure solution 3 months

  • > This is why it is so expensive…
slide-5
SLIDE 5

5

9 9

Content of this lecture

  • I. Protein crystals and how to grow them
  • II. A bit of theory – diffraction
  • III. Practice -- X-ray diffraction experiment,

phase problem and structure calculation

Suggested reading:

http://www-structmed.cimr.cam.ac.uk/course.html http://www-structure.llnl.gov/Xray/101index.html (two excellent online courses) Books

  • Cantor, C.R., and Schirmer, P.R. Biophysical Chemistry, Part II. Freeman, NY (1980)
  • Rhodes, G. Crystallography made crystal clear:

A guide for users of macromolecular models. Academic Press, N.Y. (2000)

  • Drenth, J. Principles of protein X-ray crystallography. Springer (1995)
  • Blundell, T.L. and Johnson, L.N. Protein Crystallography.

Academic Press: N.Y., London, San Francisco (1976)

  • Ducroix & Giege. Protein crystallisation

10 10

  • I. Protein crystals
slide-6
SLIDE 6

6

11 11

Crystal lattice

a b a b c γ β α

Periodic arrangement in 3 dimensions A crystal unit cell is defined by its cell constants a, b, c, α, β, γ unit cell 12 12

Crystal symmetry

asymmetric unit 2-fold symmetry axis unit cell Besides lattice translations, most crystals contain symmetry elements such as rotation axes Crystal symmetry obeys to one

  • f the space groups
slide-7
SLIDE 7

7

13 13

Protein crystals

14 14 Principle

  • Start with protein as a solution
  • Force protein to fall out of solution as solid phase
  • > amorphous precipitate or crystal

How to decrease protein solubility

  • Add precipitating agent (salt, PEG, …)
  • Change pH

Protein crystallisation

“Kristallographen brauchen Kristalle”

slide-8
SLIDE 8

8

15 15

Protein crystallisation

‘Hanging drop’: Example: Protein: 10mg/ml in 10 mM Tris buffer, pH7.5 Reservoir solution: 2M ammonium sulphate in 100mM citrate buffer, pH5.5 16 16

Phase diagram of protein crystallisation

slide-9
SLIDE 9

9

17 17

How to find crystallisation conditions

Step 1: Screening

  • Trial and error: different precipitants, pH, etc

100-1000 different conditions

  • Miniaturise: 1 µl protein / experiment per hand,

50 nl by robot

  • Automatise

Step 2: Grow large crystals

  • Optimise quantitive parameters

(concentrations, volumes) Step 3: Check whether your crystal diffracts X-rays 18 18

Requirements for crystallisation

Protein has to be:

  • Pure (chemically and ‘conformationally’)
  • Soluble to ~10 mg/ml
  • Available in mg quantities
  • Stable for at least days at crystallisation temperature
slide-10
SLIDE 10

10

19 19

Protein crystals contain lots of solvent

typically 30 to 70% solvent by volume 20 20

Packing of protein molecules into crystal lattice

a b

P6522

slide-11
SLIDE 11

11

21 21

A bit of theory – diffraction of waves

A wave: wavelength, speed, amplitide (F), phase (ϕ) The result of a two waves’ summation depends on their amplitudes and (relative) phase 22 22

Diffraction from any object

X-rays will scatter on each atom of the object:

  • scatter predominantly on electron shells, not nuclei
  • elastic (=same energy)
  • in all directions

The intensity of diffracted radiation in a particular direction will depend on the interference (=sum) of scattered waves from every atom of the object

slide-12
SLIDE 12

12

23 23

Diffraction as Fourier transform

Real space (x,y,z): electron density ρ(x,y,z) ‘Reciprocal space’ (h,k,l): diffracted waves F(h,k,l), ϕ(h,k,l) Physics tells us that the diffracted waves are Fourier transforms of the electron density:

+ +

=

xyz lz ky hx i l k h i

dxdydz e z y x e l k h F

) ( 2 ) , , (

) , , ( ) , , (

π ϕ

ρ

Moreover, a backward transform (synthesis) should bring us from waves back to the electron density:

dhdkdl e l k h F const z y x

hkl l k h i lz ky hx i

+ + + −

⋅ =

) , , ( ) ( 2

) , , ( ) , , (

ϕ π

ρ

I.e. once we know the amplitudes and phases of diffracted waves we can calculate the electron density! 24 24

Diffraction on a single (protein) molecule

Will we see anything? Theoretically, YES: spread diffraction, no reflections But practically:

  • Very low intensity of diffracted radiation
  • Radiation would kill the molecule before satisfactory

diffraction data are collected

  • Orientation of a single molecule would have to be fixated somehow
slide-13
SLIDE 13

13

25 25

Intensität

Detektor

1 2

Diffraction on a crystal

Here we start seeing sharp peaks: the Fourier transform becomes nonzero only for integer values of h,k,l 26 26

What do we see in a crystal diffraction pattern?

Locations of reflections depend on the crystal lattice parameters and crystal

  • rientation

Intensities of reflections correspond to the squared amplitudes of diffracted waves

slide-14
SLIDE 14

14

27 27

  • III. Practice. A. Diffraction data collection

X-ray sources:

  • X-ray generator (λ=1.54Å)
  • Synchrotron (λ=0.6Å-2Å)

Monochromatic, parallel X-ray beam Monochromatic, parallel X-ray beam Crystal Crystal

2θ 2θ

Flat detector Flat detector

28 28

Diffraction geometry

Diffraction angle:

2Θ = arctan ∆ / M

Bragg’s formula:

d = λ / (2 sin Θ)

d is resolution in Å ~ the smallest spacing that will be resolved

slide-15
SLIDE 15

15

29 29 Old: sealed capillary

  • > crystal stays at 100%

humidity nylon loop vitrified solution crystal

Crystal mount

Modern: “flash cooling” to T=100oK in nitrogen stream Problem: Radiation damage 30 30

Data collection

Slowly rotate the crystal by the (horisontal) axis, record one image per each ~1o rotation ~ 100 images with ~100-1000 reflections each = ~ 104 – 105 reflections

slide-16
SLIDE 16

16

31 31

Diffraction quality

1. What is the maximal resolution? 2. Is it a nice single lattice? 32 32

Indexing and integration

1. Assign indices h,k,l to each reflection 2. Record intensity

  • f each reflection

h = 8 k = 12 l = 13 I = 12345 -> F = 111.2

slide-17
SLIDE 17

17

33 33

  • B. Phase problem

Fourier synthesis: However, there is a problem: experiment yields amplitudes of reflections but not phases: Amplitude F = sqrt(I) Phase ϕ - ?

+ + + −

⋅ =

hkl i lz ky hx i hkl

hkl

e F const z y x

ϕ π

ρ

) ( 2

) , , (

34 34

Phases are more important than amplitudes

http://www.ysbl.york.ac.uk/~cowtan/fourier/fourier.html

slide-18
SLIDE 18

18

35 35

Methods to solve the phase problem

  • 1. Isomorphous replacement by heavy atoms (MIR)
  • 2. Molecular replacement by a similar structure (MR)
  • 3. Anomalous X-ray scattering on a heavy atom (MAD)
  • 4. Direct methods -> ‘guess the phase’

We will only discuss the first two… 36 36

Multiple isomorphous replacement

  • 1. Soak a heavy atom (U, Hg, Pt, Au, Ag…) into your crystal
  • 2. Hope that (a) the heavy atom is specifically binding to a few positions on the

protein and (b) the binding does not change the protein conformation or crystal cell parameters (‘isomorphism’)

  • 3. Collect a new diffraction data set from the derivatised crystal -> FPH1
  • 4. Repeat for at least one another derivative -> FPH2
  • 5. Then there is a computation procedure that yields an estimate
  • f protein (‘native’) phases:

FP (native protein crystal) FPH1 (derivative 1)

  • > ϕP

(estimate)

FPH2 (derivative 2)

  • 6. Do a Fourier synthesis with FP and ϕP
slide-19
SLIDE 19

19

37 37

Molecular replacement

  • 1. You have to know the 3D structure of a related protein
  • 2. If the two structures are close, there is a computational procedure that finds

the correct position/orientation of the known structure in the new cell

  • 3. Use the measured amplitudes FP

and the phases calculated from the model ϕmodel for Fourier synthesis 38 38

  • C. From electron density to atomic model
slide-20
SLIDE 20

20

39 39 40 40

Building and refining atomic model

Observed amplitudes, initial phases Initial electron density map Initial model Observed amplitudes, phases calculated from the model Better map Final model Automated refinement: Program attempts to minimise the discrepancy between the observed amplitudes and those calculated from the model by adjusting the positions

  • f atoms as well as their occupancies and temperature factors

Restraints: stereochemistry FS FS FT model build model build

slide-21
SLIDE 21

21

41 41

Model quality

  • 1. Model should match experimental data

Fobs – observed amplitudes Fcalc – calculated from the model

R-factor

  • 2. Model should have

good stereochemistry

∑ ∑

− =

  • bs

calc

  • bs

F F F R /

42 42

Resolution

slide-22
SLIDE 22

22

43 43

Resolution and accuracy

  • Once resolution is better than ~3Å, building (and refinement) of a

full atomic model (except hydrogens) becomes possible

  • But the accuracy in atoms positions

is much better (~ few tens of Å), especially since the model is stereochemically restrained

Ultrahigh resolution

Current record is about 0.6Å:

  • hydrogens seen
  • valent electrons seen

44 44

Atomic temperature factor

May either reflect the true thermal motion of the molecule

  • r

a conformation variability from unit cell to unit cell