
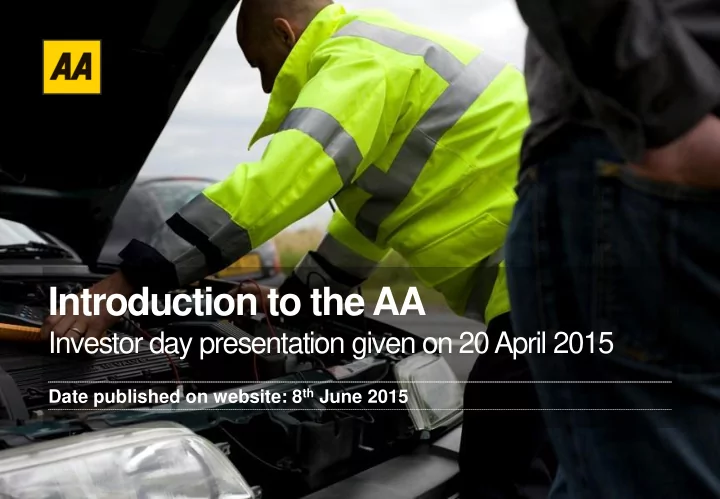
SLIDE 1
Introduction to the AA
Investor day presentation given on 20 April 2015
Date published on website: 8th June 2015
Introduction to the AA Investor day presentation given on 20 April - - PowerPoint PPT Presentation
Introduction to the AA Investor day presentation given on 20 April 2015 Date published on website: 8 th June 2015 Important notice 2 This document does not constitute or form part of any offer or invitation to sell or issue, or any solicitation
Date published on website: 8th June 2015
This document does not constitute or form part of any offer or invitation to sell or issue, or any solicitation of any offer to purchase or subscribe for, any securities of AA plc or its subsidiaries (the “Company”) nor shall it or any part of it nor the fact of its distribution form the basis of, or be relied on in connection with, any contract commitment or investment decision in relation to any such matter nor does it constitute a recommendation regarding the securities of the Company. Investors and prospective investors in securities of the Company are required to make their own independent investigation and appraisal of the business and financial condition of the Company and the nature of the securities. Any decision to purchase securities in the context of a proposed
Securities of the Company have not been and will not be registered under the United States Securities Act of 1933, as amended (the “Securities Act”), and may not be offered or sold within the United States except pursuant to an exemption from, or in a transaction not subject to, the registration requirements of the Securities Act. No public offer of securities of the Company is being made in the United States. Neither this document nor any copy of it may be taken or transmitted into the United States, its territories or possessions or distributed, directly or indirectly, in the United States, its territories or possessions. Neither this document nor any copy of it may be taken or transmitted into Australia, Canada, Japan, Switzerland, New Zealand or the Republic of South Africa or to any person in any of those jurisdictions. Any failure to comply with this restriction may constitute a violation of United States, Australian, Canadian, Japanese, Swiss, New Zealand or South African securities law. The distribution of this document in other jurisdictions may be restricted by law and persons into whose possession this document comes should inform themselves about, and observe, any such restrictions. Subject to certain exceptions, securities of the Company may not be offered or sold within the United States, Canada, Australia, Japan, Switzerland, New Zealand or the Republic of South Africa or to any national, resident or citizen of the United States, Canada, Australia, Japan, Switzerland, New Zealand or the Republic of South Africa. This presentation may include certain forward-looking statements, beliefs or opinions, including statements with respect to the Company’s business, financial condition and results of operations. These statements, which contain the words “anticipate”, “believe”, “intend”, “estimate”, “expect”, “forecast” and words of similar meaning, reflect the Directors’ beliefs and expectations and involve risk and uncertainty because they relate to events and depend on circumstances that will occur in the future. No representation is made that any of these statements or forecasts will come to pass or that any forecast results will be achieved. There are a number of factors that could cause actual results and developments to differ materially from those expressed or implied by these statements and forecasts. Past performance of the Company cannot be relied on as a guide to future performance. Forward-looking statements speak only as at the date of this presentation and are also provided strictly on an estimate and approximate basis, further the Company expressly disclaims any obligations or undertaking to release any update of, or revisions to, any forward-looking statements in this presentation. No statement in this presentation is intended to be a profit forecast. As a result, you are cautioned not to place any undue reliance on such forward-looking statements.
The following definitions apply throughout the presentation:
Trading EBITDA (earnings before interest, tax, depreciation and amortisation): excludes exceptional items, share-based payments, acquisition earn-out costs and items not allocated to a segment. Adjusted EPS: adjusts for one-off adjustments from financing transactions, exceptional items, share-based payments, acquisition earn-out costs and applies tax at the Group’s effective rate. Cash conversion: net cash flow from operating activities before tax and exceptional items divided by Trading EBITDA. Financial Year: the Financial Year ends on 31 January and represents the 12 month period ended 31 January. Personal Members and Business Customers: measured as the number at the period end.
Topic Start time
Lunch and Walk of Pride 12:30 Introduction 13:30 Financials 13:45 Roadside Assistance 14:00 Service delivery 14:45 AA Help demonstration 15:15 Coffee
15:45
Membership Services 16:00 Insurance 16:30 Close and Q&A 17:00 Drinks and Walk of Pride 17:45
Oliver Kunc Operations Director
Previously Managing Director of Central Heating Installations at British Gas Prior roles at Barclays, BA and L.E.K. MA Oxford University and MBA from LBS
Bob Mackenzie Executive Chairman
Previously Chairman and CEO of National Car Parks and its subsidiary Green Flag Prior to that CEO of Sea Containers ltd and Chairman of PHS Group plc
Mike Lloyd Commercial Director
Previously Partner at Oliver Wyman, focused on Consumer Service businesses in FS, Energy, Home, TV and Telecoms Graduated from Cambridge University
Kirsty Ross Membership Services Director
Previously Strategy and Innovations Director Prior to that Principal at Oliver Wyman Graduated from Oxford University
Janet Connor Managing Director Insurance
Previously Managing Director at More Than Prior to that MD at Ageas-owned over-50s broker RIAS from 2006 to 2011 Fellow of the Institute of Directors
Martin Clarke Chief Financial Officer
Previously Partner and Global Head
Prior roles at Cinven, Silverfleet and board member of New Look and Gala Coral
1905 1907 1909 1912 1939 1949 1973 2003 2009 2010 2014 1992
Founded by motoring enthusiasts 35% share
the road Launched Roadwatch and Relay Patrols issued with diagnostics equipment Patrols on bicycles and uniforms DriveTech and Auto Windshields acquired
IPO
Launched AA Routes and AA Stars 1st AA insurance policy New fleet to enable four wheel patrols BSM acquired, launch Home Services Launched AA Driving School
Segment
Roadside Assistance Insurance Services Driving Services Ireland Membership Services
Included in Roadside Assistance FY15 Trading EBITDA %1
£359m £84m £20m £15m £7m
Highlights
Leading provider in the UK 3.8m personal Members and 9.6m B2B customers 3,000 dedicated patrols, reaching 10,000 breakdowns per day No 1 market share (c40%) High personal member retention rate Leading insurance broker Offers Motor, Home, Travel and other specialist insurance Significant cross-sell to existing customers Also includes Home Services and Financial Services Provides educational driver awareness courses, fleet management and driver training Largest driving school in the UK2 (under AA and BSM brands) Leading branded breakdown provider and leading insurance broker in Ireland Publishing, Hotel Services, Digital and Car Essentials Motoring Services including BCA Car Inspections, Signs, Warranties and AA Cars
75% 18% 4% 3%
1.5%
Presenting today Presenting today Presenting today
Market fundamentals Strong, stable margins and cash conversion High barriers to entry, scale cost advantage Trusted brand The UK’s most trusted commercial brand1 Over 50% of households hold an AA product Market leadership 3.8m personal Members, 9.6m B2B customers #2 motor insurance broker, #1 driving school Retention and loyalty High Member retention, long-term B2B contracts Significant revenues from repeat business Operational excellence 3.5m breakdowns attended pa Sophisticated deployment IP and services Options for growth Trusted brand lends to relevant extensions 20m marketing contacts, strong cross-sell ability
Broad based under investment; eg in systems, brand and capabilities Legacy of short-term decision making Premium position not underpinned by continuous investment in proposition IT platform, except patrol deployment, dated and constraining growth Individual business unit optimisation restricts commercial opportunity Limited and inflexible CRM systems No investment in brand marketing for many years Creates opportunity, but significant work to do
Strategic objectives Key initiatives
Invest in technology and people Increase roadside membership through leading service and loyalty Deliver a step-change in Digital capability Evolve the Insurance Services and Financial Services business models to drive profitable growth Leverage the brand to capture the
Grow our B2B service offering through greater integration with our partners
Strengthen the AA as the pre-eminent motoring services organisation in the UK
Reduce Group borrowings and the associated interest costs
Revolutionise customer experience through investing in and embracing new technologies
Redesigned organisational structure, new executive team IT roadmap laid out; started investment in core systems Systematic capabilities and talent review Property review underway Investment in patrols and front line staff Governance and controls in place Premium listing and FTSE indexation confirmed Refinancing complete, and plan to pay dividend by end FY16 Solid progress to date
Core business performance flat Several years of under-investment by previous owners Period of investment and consolidation to position AA for renewed growth To be achieved through – Investment in brand marketing – Investment in IT systems and digital capability – Restructuring and cost initiatives – Investment in Membership growth and price – New business initiatives Refinancing to free up additional cashflow and facilitate dividends Investment creates longer term opportunities
De-risk infrastructure; operational stability and supported systems More efficient systems; less manual processing; higher productivity Flexibility and agility in commercial decision making Stronger CRM capabilities; opportunity for digital propositions and cross-sell Smoother, hassle-free experience for members Enhanced deployment and patrol support Enabler for further opex savings
IT transformation to modernise the business and enhance customer experience – Transformation capex of £128m over 3 years – Impact on depreciation and opex – Thereafter facilitates cost savings and reduced capex Cost rationalisation expected to deliver £40m of cost savings in medium term – Phase 1 underway and expected to deliver £8m in FY17 Short term uplift in capex to facilitate transformation – Thereafter steady state IT capex of £10m pa (versus £30m pa) £10m investment in brand marketing in FY16 and beyond
Transform the AA into a modern, technologically led Membership business Reinforce and develop our unrivalled brand building on our tradition of services Enhance and broaden the range of products and services available to our Members
Revenue up 1.0% to £983.5m Trading EBITDA1 up 1.7% to £430.1m Trading EBITDA margin up 30 bps to 43.7% Adjusted EPS2 (before refinancing) of 23.3p (38.0p) Cash conversion3 100% (102%) Dividends of c£50m expected to be recommended in respect of FY16
Stable growth, high margins and low cash requirements
(£m)
£968m £974m £984m £395m £423m £430m
FY13A FY14A FY15A Revenue Trading EBITDA
40.8% 43.4% 43.7% Trading EBITDA margin
Capital expenditure
3.3% 4.0% 10.1% % of revenue £32m £39m £99m
FY13A FY14A FY15A
Working Capital defined as stock, plus amounts due from debtors, less amounts due to creditors, deferred income and provisions for future costs, excluding balances relating to corporate income taxation, pensions, finance leases, deferred consideration and non-trading intercompany balances. Change in working capital derived from unaudited, non-statutory management information excluding the impact of exceptional items, restricted cash and pensions
Change in working capital
Impact on cash flow2 (£3.7m) (£14.9m) £0.4m
FY13A FY14A FY15A
Increasing EBITDA year on year Favourable working capital dynamics as a function of upfront payments by customers
Cash flow generation (£m)
Net cash flow from operating activities before tax and exceptional items3 £371m
£395m £423m £430m 93.9% 102.4% 100.1% FY13A FY14A FY15A Trading EBITDA¹ Cash Conversion²
£433m £431m
Trading EBITDA (£m) Trading revenue (£m)1
Margin +£90m +1.6% pa +£96m +4.3% pa £893m £931m £943m £979m £971m £974m £984m FY09 FY10 FY11 FY12 FY13 FY14 FY15 £334m £369m £371m £368m £395m £423m £430m FY09 FY10 FY11 FY12 FY13 FY14 FY15 39.6% 39.3% 37.6% 40.7% 43.4% 43.7% 37.4%
activity within the Acromas group.
Reduce overall cost of debt Increase average maturity Simplify debt structure Facilitate payment of dividends Reduce cost of debt and enable dividend
Raise £200m new equity to efficiently pay off balance of PIK Notes Issue £735m new high yield bonds to repay existing Class B Notes Repay £209m of Senior Term Facility from existing cash in WBS Impact – Reduced leverage – Reduced cash interest costs – Facilitates payment of dividends in respect of FY16 and thereafter
£663m £475m £500m £500m £250m £655m £175m £259m
Senior Term Facility Class A1 notes Class A2 notes Class A3 notes Class A4 notes Class B notes PIK notes Cash
Highly leveraged capital structure 7.5 x gross debt / FY15 EBITDA High interest charges on PIK and B notes at 9.5% Blended interest cost of 5.9% Interest cover2 2.3x
Blended interest rate 5.9% including PIK 5.7% excluding PIK £3,218m Fixed interest rates (with LIBOR hedged for Senior Term Facility) Interest rate 3.98%1 4.72% 6.27% 4.25% 3.78% 9.5% 9.5% Effective maturity 2019 2018 2025 2020 2019 2019 2019 Final maturity 2019 2043 2043 2043 2043 2043 2019
Notes
1 Senior Term Facility at LIBOR + 2%. As a result of
certain hedging arrangements LIBOR is effectively fixed at 1.9797% until July 2018 and 2.9985% for the period between August 2018 and January 2019, such that if the Class A notes are rated “BBB-” or above, the maximum rate of interest payable until 31July 2018 is 3.9797%
2 Trading EBITDA divided by cash finance costs
excluding any early repayment fees
Reduces interest charges and facilitates the paying of dividends
Sources £m Uses £m New Class B 735 PIK redemption 175 Equity placement 200 Class B redemption 655 Balance sheet cash used 209 STF partial redemption 209 Break costs on PIK 4 Break costs on B notes 60 New issuance fees 25 PLC non-ring fenced cash 16 Total sources 1,144 Total uses 1,144
Leverage 6.8x gross debt / FY15 EBITDA Lower blended cost of debt at 4.9% Average maturity extended to 6 years
£454m £475m £500m £500m £250m £735m £50m
Senior Term Facility Class A1 notes Class A2 notes Class A3 notes Class A4 notes New Class B notes Cash
£2,914m Fixed interest rates (with LIBOR hedged for Senior Term Facility) Interest rate 3.98%1 4.72% 6.27% 4.25% 3.78% 5.50% Effective maturity 2019 2018 2025 2020 2019 2022 Final maturity 2019 2043 2043 2043 2043 2043
Note: 1 Senior Term Facility at LIBOR + 2%. As a result of certain hedging arrangements LIBOR is effectively fixed at 1.9797% until July 2018 and 2.9985% for the period between August 2018 and January 2019, such that if the Class A notes are rated “BBB-” or above, the maximum rate of interest payable until 31 July 2018 is 3.9797%
Reduced cash interest cost by £46.7m with corresponding EPS enhancement Since IPO gross debt reduced by £470m Near term maturities (pre 2020) reduced from 69% to 40% of outstanding debt WBS dividend gating covenants simplified – Removal of PIK notes sets gating covenant for dividends at <5.5x EBITDA / net senior debt (currently within this at 5.1x) Significant savings in interest charges and enabling meaningful dividend
The AA’s foundations are strong FY16 a year of transition, consolidation and investment Refinancing to create a stable medium-term capital structure Dividends of c£50m expected to be recommended in respect of FY16 Progressive dividend policy thereafter Strong cash flow will facilitate further substantial deleveraging in medium term
Revenue and Trading EBITDA
Leader in Roadside Assistance Large base of 3.8m Members c40% market share in consumer market High customer satisfaction Customer loyalty leads to high renewals
697 713 728 323 348 359 FY13A FY14A FY15A Revenue Trading EBITDA
Fleet and leasing Motor manufacturers Banking: Added Value Accounts
Provides Breakdown cover with new and used car warranties sold by dealers Also provides vehicle fault and performance data
1
Provides Breakdown cover to SMEs, commercial fleets and leasing companies, and corporate-owned van fleets Other services eg risk management
2
Provides Breakdown cover to Lloyds Banking Group and TSB Added Value Accounts (AVAs)
3 Together, B2C and B2B cover 13.4 million customers
Trusted brand The UK’s most trusted commercial Brand1 Over 50% of households hold an AA product Customer loyalty Strong Membership retention Average tenure 11 years, 800k > 20 years Market leadership 3.8m personal Members, 9.6m through B2B Over 3,000 dedicated patrols Operational excellence 3.5m breakdowns attended pa Unique services and deployment IP
Source: Y&R Brand Asset Valuator Survey (2014).
Differentiation, high loyalty, economies of scale, high to replicate IP
“Which?” Recommended Provider UK’s 5 most trusted commercial brands1
75 72 69 The AA is still the mainstream breakdown provider of choice. Which?, 2014
1. 2. 3. 4. 5.
Source: Y&R Brand Asset Valuator survey in 2014, Which? breakdown service providers review 2014
1 Excludes charities and armed forces.
AA Membership vs. GDP growth
Financial crisis US savings and loan crisis Early 1980s recession Oil crisis Membership run-up and reduction following demutualisation 5.0 4.0 3.0 2.0 1.0 1975 1980 1985 1990 1995 2000 2005 2010 2015 20% 15% 10% 5% 0%
0.0 AA Members (m) UK GDP growth (%)
Sources: Internal AA data; ONS
Breakdowns attended Consumer market share B2B market share
AA 40% RAC 27% GF 14% Others 19%
3.5m 2.3m 0.7m Consumer B2B
Sources: Lake Research “Road market share tracker( Sep-14); Internal AA data; Company Websites (RAC / GF)
Motor manufacturers Fleets AVA
Unique deployment IP Modern multi-vehicle service technology 80% of breakdowns repaired at roadside Skilled and experienced colleagues Average of 11 years tenure with the AA AA “moment of truth” survey (%)
57% 68% 50% 26% 20% 33%
Overall experience with the AA Service provided by Patrol Overall experience
Excellent Very Good
Technical assets and expertise… …and high levels of customer service
Source: AA Customer Survey
Fantastic underlying assets; brand, loyalty, leadership and operational scale Past profit growth drivers have been stretched as far as they can Need to reinvest to restart growth engine
Legacy of short-term decision making – across key marketing areas: – Shorter-term pricing focus – Marketing investment cuts – Limited product and service innovation pipeline
Broad-based under-investment eg in systems, brand and capabilities – IT platform and CRM systems dated and constraining growth – No brand marketing – direct response focused – Lack of digital investment
Year on year change in personal Members Income per Member AA share of voice in media
0.0%
FY12 FY13 FY14 FY15 £113 £119 £126 £135 FY12 FY13 FY14 FY15 22% 11% 4% 2% 2011 2012 2013 2014
Change
New systems to improve speed to market, learning, flexibility Add to commercial capabilities to deliver change
Trade better
Shorter-term Drive immediate opportunities to fund growth investment Longer-term More sophisticated value management to drive strong marketing returns
Supported by investment in CRM systems, service innovation and the brand
Drive growth
Drive growth in Members and services per Member Investment in innovation and the AA brand
Drive performance and deliver EBITDA to fund growth investment
Key plans
plan to step-change renewal performance
applying strong analytics
from paper and calls into digital channels
Feb Mar April May June July Aug Sept Oct Nov Dec Jan Discount rate Save rate
Save rate up 4% points; discount rate down 6% points since re-launch
Stay AA re-launch in March Discount rate down 6 percentage points Save rate up 4 percentage points
Re-establish growth in the Membership by redeveloping the Membership proposition
Key plans
above-the-line advertising
developing and implementing a new product pipeline
beyond breakdown integrating with broader AA services
capabilities
trials and developing connected propositions
AA media spend and share of voice
Plans
Broaden from only direct response marketing Invest c£10m in above-the-line marketing Additional capabilities created internally Effectiveness analysis used to determine
Benefits
Market share of new business and improved campaign efficiency Rational and emotional impact on retention Employee engagement
Sources: Ebiquity Media Tracking (TV, Press, Radio, Cinema, Outdoor), Road Brand Tracker Survey, IPSOS
66% 47% 57% 31% 21% 22% 11% 4% 2%
2006 2007 2008 2009 2010 2011 2012 2013 2014 Total media spend AA Share of voice
Connect and services Self-service Sales
AA digital platform
1
From: No self-service, phone and paper based To: Integrated multi- channel service Lowering contact cost intelligently
Self-service
From: Ageing platform To: Flexible low cost platform Lower maintenance, rapid digital development
Digital platform
4
From: Broad, but fragmented content To: UK’s digital motoring and travel hub integrating Membership Services Retention and cross-sell shift
Content and services
3
From: Old platform and limited capabilities To: Best-in-class digital sales capabilities Step-change in digital sales performance
Sales
2
Selected plans
New partnerships Telematics eCall and bCall Operational R&D
Membership in the modern world
Across four areas accelerated proposition development and trials Developments in each market area support the others Expanded operational investment in technology and capabilities
Consumers Manufacturers Insurance Fleet
Upgrade commercial capabilities, the organisation and core systems
Key plans
Members with the right messages in the best channel
digital services, self-service and sales capabilities
improvements to enable us to drive stronger marketing and growth investment returns
Leading the market with stronger product and service innovation Innovative Re-invigorated membership proposition supported by stronger CRM and digital services Dedicated to Members Strengthened brand, operation, people, systems and digital platforms Strengthened core assets Supports rebalanced and more sustainable sources of profit growth Quicker to market with more targeted communications, offers and investment in current and prospective Members Agile
Strong underlying core – key strategic advantages in this market Past profit drivers not sustainable in the long-term (marketing cuts and pricing) Key areas of trading being driven to generate profit to re-invest Investment in brand, product and services, digital and Connected Car in plan – Progressively landing these investments of the next 3 years Expectation to halt, then reverse, decline in Membership numbers – Move to a more balanced and sustainable profit growth engine Built on unique assets – old and new
Breakdown patrols 2,032 Recovery patrols 452 Garage agents c350 Motorcycle patrols 20 Fuel Assist 59 Key Assist 15 Dedicated technicians 163 Other 360
(incl. Battery Assist, Glass, Home Emergency and Inspections)
13.4m customers 3.5m breakdowns pa Over 3,000 AA patrols
Breakdown Recovery Fuel Assist Key Assist Battery Assist Glass Motorcycle breakdown Motorcycle recovery SORT Vehicle inspections Dealer audits Accident management
c30 manufacturers supported - c67% of the new car market… …including unbranded vans for key accounts
Pay for use and insured roadside cover provided to seven of top 10 UK leasing companies Direct operational fleets Additional services include incident management, accident / risk management and HGV Long term relationship with Lloyds Banking Group and TSB Providing various levels of roadside cover to around 4m customers Home emergency cover provided to selected account holders
Added Value Accounts (AVAs) Fleets
Key pillars to our continued success
Exceptional service
Deep expertise
Constant innovation
Commercial focus
Centralised operations in Oldbury 460 contact centre advisors 320 service advisors New integrated app growing in usage in 2015 Call handling 80% in 20 seconds App usage <1% Average call time <5 minutes Call to arrive time 45 minutes
Prestige brands 150 teleworkers Volkswagen Group Police
Leicester training centre Self-managed recovery fleet Dedicated B2B resource International network (ARC) Fuel Assist Key Assist Battery Assist Special operations, Motorcycles, Glass, …
Patrol repair rate c80% Dedicated B2B resource c140k jobs Average patrol tenure 11 years
Best diagnostics tool in market Multi-year deal / exclusivity Retrofitted Bluetooth connected Significant fleet upgrade Speed of deployment Safety improvements Flexibility eg motorbikes
Compact Recover Trailer (CRT) Bosch diagnostic systems
Tight operational and cost control Systems and controls
Scale of business drives density of work, and cost efficiencies Proprietary deployment tool (AA Help)
Flexibility to manage peaks in demand – multi-skilled workforce and garaging Service expertise drives strong “tail” management Expertise improves repair rate, reduces “second resource” and improves fix time
Which? “Recommended Provider” for 4 years running Highest test score for a major provider from ‘Which?’ every year since 2007 Highest scores for core performance (eg call to arrive and Roadside repair rate)… …and highest scores for customer satisfaction across both the 2013 and 2014 surveys Highest overall ratings… … and ahead on key metrics The AA is still the mainstream breakdown provider of choice.
Which?, 2014 75 72 69
Source: Which? breakdown service providers review 2014
Rolling 12 month inflation adjusted variable cost per case
Indexed to 100
84 86 88 90 92 94 96 98 100 102
Feb-11 Aug-11 Feb-12 Aug-12 Feb-13 Aug-13 Feb-14 Aug-14
Source: AA internal Data
CRM systems aging and require significant upgrade Previously stretched fleet renewal cycles Reduced investment in training in last 5 years Strong focus in recent years on improving “as is”; not modernising Investment to turn challenges into opportunities
Modernise our systems and fleet for efficiency and member experience Investment in infrastructure Re-emphasise training and continue to improve service by the roadside Patrol 2020 Revolutionise the member’s breakdown experience through digital (mobile first) Embrace digital Invest in Connected Car to future-proof the operation and continue to innovate Invest in Connected Car Trial and grow specialist services using
Commercial
Exceptional service
– Investment in front end systems – Refresh patrol infrastructure; technology and fleet
Deep experience
– Upgrade patrol training – Recruitment and retention focus to identify and build expertise
Constant innovation
– App development – Investment in Connected Car driven operating model
Commercial focus
– Drive growth of existing commercial areas – New B2B and B2C services
Strong operating model – unique and at significant scale Challenging market with recent underinvestment Opportunity to strengthen core assets Investment focused on further building out existing strengths Modernisation is starting and will drive continuous evolution Opportunity to improve service, efficiency and commercial focus in the medium-term from a strong baseline
Value generated within own P&L by selling Membership products and services
Significant opportunities for growth in both areas Media Motoring Services
Value generated for AA group by strengthening the Roadside Member proposition Member acquisition Member retention
c250 non-fiction titles across atlases, maps, driving, travel, leisure and “AA Inspected” guides (eg hotels) UK and International Subscription income from hotels, B&B, caravan and campsites, in return for an annual AA inspector visit and AA Guide profile Consultancy and training events Advertising revenue from Route Planner Creation of digital content eg eBooks Roadwatch traffic advice service “Car Essentials” products eg European breakdown kits Sold through major retailers, AA webshop and Eurotunnel shop
Publishing Hotel Services Digital Commercial
15pt car inspection pre-auction AA technicians based at BCA sites
BCA assured
Sign production and traffic management for events and housing developments
Signs
Warranty products eg Mechanical Breakdown Insurance B2B2C via dealers
Warranties
Used-car site, with
and 2.5k dealers Launched in September 2013
AA Cars
154 point vehicle safety inspection Car data checks covering eg
finance, write-offs
Inspections and History Checks AA Tyres: New mobile tyres business launched in April ’15 Service and Repair: eg Garage inspection program launched 2014
New Business
Stable and profitable portfolio of core Membership Services businesses Wide ranging experience and capabilities – “right to play” in broader Motoring Services AA reputation for trust unique in markets characterised by lack of transparency Proprietary sales channels not available to competitors eg Roadside Members Powerful historic position in navigation, travel and hotels Positive halo benefit on AA brand reputation and member proposition
Limited appetite to make investment with long-term paybacks in the past, resulting in some businesses lacking in scale Fragmented markets: need to be selective where and how we choose to operate Business models not evolved in Digital Age, new competitors in some markets Operated independently in the past, limiting connection to the broader AA Membership base
Modernise the core; strengthen the AA proposition; grow in new markets
Build on the AA’s investment in digital
Leverage our products and services to enhance the Member proposition
Build on the AA’s reputation for trust to grow in adjacent markets
Now integrated with core breakdown app Simpler and cleaner layout and useability More frequent engagement with the app Future opportunity: over 50% of visitors to AA website come to read Media content
Developments this year focused on Route Planner traffic and hotels and travel content
Hotels and Restaurants Car Essentials Publishing
research
inspection
purchase
car care
valet
and navigation
c£60bn
38% of consumers suspect there was a problem with the used car they bought 83% of consumers are not confident in the price they get at their garage “Have you ever bought a used car that you later suspected had any of the following?” “The cost of Service and Repair was higher than I expected”
No issue Mechanical/
59% 23% 17% Agree Unsure Disagree
Source: AA Populus Panel 2013 and 2014
38%
In an accident Clocked Outstanding finance
Key opportunities: Used Car Sales Tyres Car Inspections Garages – Services, Maintenance and Repair Dealer Solutions …
Significant potential to build on existing assets in new markets
c£60bn broader Motoring Services market – the AA currently focused
Unique strength of the AA Brand in markets with low customer trust
Focus for today
Largest used car dealers, by stock AA Cars USPs
50,900 106,352 112,600 115,259 120,762 124,999 162,769 255,774 404,613 What Car RAC Cars Sun Motors Driving E&M Pistonheads AA Cars Motors Autotrader
Source: Company Websites
Selected growth plans Improve use of digital Drive vehicle inspections Open up new marketing channels Selective dealer targeting Free comprehensive Car History Check Unique AA content Free breakdown cover
AA Tyres: product and business model innovation
Market-leading proposition
– Competitive price; AA quality – Online / mobile booking process – Next day service; to home or work
Cost efficient and lean
– No fixed retail network – Supply chain management
Agile delivery model
– Collaboration with Mobile Tyre specialist – Minimises execution risk… – …whilst leveraging AA assets
Tyres are the 2nd most common cause of breakdowns…
10 20 30 Battery Tyre Engine Alternator Starter motor Clutch Lights (interior) Spark plugs Fuel pump (electrical) Cylinder head gasket Other And growing – as many new cars do not carry a spare tyre 17% 15%
Source: AA internal Data
Set up in 2014 to bring together the value-added services which the AA offers Members and strengthen the Membership proposition Two key business segments: Media and Motoring Services Pursuing several additional opportunities, in line with broader AA membership strategy – Implementing digital transformation – Adding value to the Membership proposition – Building on recent launches in adjacent markets Powerful existing assets, strong brand presence, particularly in the motoring market – A number of opportunities to drive significant growth in future
Core insurance revenue breakdown
Value-added broker model
Motor / Home insurance underwritten by panel Panel actively managed Insurance strengthens Road Membership base
Scale in distribution
#9 personal lines broker in the UK by premium3 #2 home insurance broker by policies in force4 #2 motor insurance broker by policies in force4
The AA’s current business model
Motor (55%) Other (6%) Home (39%)
Core insurance policies in force
Product Policies1
Roadside Members2
Motor 635k 63% Home 907k 42%
Sources: 1: AA Internal Data, for the 12 months to 31/01/15 2: % of Insurance Policy holders that are also Roadside Assistance Personal Members 3: Insurance Times 2014 survey 4: GFK February 2015
Strong brand, frequent customer contact Long history, high awareness and consideration Extensive customer data and contact base Attractive risk-profile of Members Various commercial models across c20 products outside motor and home Outsourced – travel, pet, etc. Referral – learner drivers The AA’s panel model Brand and customers attractive for panel
Strong and diversified set of panel members Large and specialist players participate for different customer segments Insurer provides net rate, the AA then creates a customer price AA manages customer policy adminstration Insurer manages the claims process
Brand Consideration1
for switching Motor Insurance
Quote to Click conversion2
by position on MoneySupermarket
Dec 2010 Dec 2011 Dec 2012 Dec 2013 Dec 2014
AA Admiral Aviva Direct Line Churchill Tesco Morethan RAC Post Office Hastings Direct
1st 2nd 3rd AA Market
Sources: 1: GFK FRS Motor Dec 2014 of top 15 brands 2: eBenchmarkers Autumn 2014
Used in relatively basic way today Cross-sell from and into Roadside Rates tailored for AA Members Efficiency in direct marketing Data protects profitability for insurer partners Opportunity to do more in future Further integration with Roadside to strengthen propositions and Membership Commercial agility driven through more sophisticated analytical techniques We understand our customers… … facilitating customer engagement, sales and retention
personal members
breakdowns a year
policy records
vehicle records
Source: AA internal Data
Broader market development: – Importance of price comparison websites – Margin squeeze – Pace of regulatory change – Direct competition Customer decisions driven more and more by price, and less by brand Broker model challenged: – Limited view of end-to-end profitability – Adds cost into the value chain (already suffering from low margins) AA currently lacks pricing agility in an increasingly dynamic marketplace
Motor insurance policies in force (shown since 2010)
Motor insurance stabilised in FY15 through investment in pricing and marketing
2011 2012 2013 2014
c960k in 2011 c635k today
Source: AA Internal Data
2015
Customers predominately buy through PCWs Very high elasticity of demand – especially around top ranking positions 3/4 of customers shop around, and 1/3 switch at renewal for cheaper price
Market growth of online and PCWs1
% of new policies
Main factors driving Motor insurance purchase decision2
20 40 60 80 100
1997 2000 2003 2006 2009 2012 2015
Other online Price Comparison Website (PCW)
Cost of policy
85%
Features of policy
15%
Previous knowledge / experience of company
12%
Sources: 1: FPK, Datamonitor, eBenchmarkers 2: GFK FRS Motor Dec 2014 – all policies, responses were all that apply
Increasing conversion Brand strength under-utilised due to pricing However, extensive policy and customer data does give the AA ability to compete Future winners – AA well placed Relationship and niche portfolio owners Effective end-to-end claims management Analytics focused Providers not burdened by legacy systems Share of new business vs. brand Consideration in Motor Opportunity for the AA
Hastings Admiral
Brands that underperform Consideration Brands
Consideration
Aviva Tesco Brand Consideration (%) Share of new business (%)
Source: GFK FRS Motor Dec 2014
Market fragmentation leads to inefficiency – many providers competing to make a return Market evolution has reduced the value added of the traditional broker model PCWs here to stay – model may be constrained
Activities in personal lines insurance value chain
Google PCWs Broker Insurer
Players:
Lead generation Price comparison & quotation Sales New business fulfilment Policy admin & servicing Pricing & under- writing Claims handling Investment & solvency
Make better use of unique data to drive more agile and competitive pricing for Members Broker will enable panel to price on own systems and make best use of data Improve customer experience and lower claims costs
Activities in personal lines insurance value chain
Lead generation Price comparison & quotation Sales New business fulfilment Policy admin & servicing Pricing & under- writing Claims handling Investment & solvency
Google PCWs Broker Insurer
Players:
Effective business model that maximises use of capital AND broker value New agile IT systems, integrated with AA and high-value external databases Newly built capabilities drive excellence in data mining and agile pricing Integrated policy and claims management, unencumbered by legacy systems Leveraging robust controls and governance, mitigating conflicts Experienced, proven team that has created and run successful operations Greenfield systems, new capabilities, combined with strong brand and proprietary customer data, provides significant medium-term growth opportunity
c25% of capital provided in-house Combining co-insurance/ re-insurance with in-house capital gives balance of strategic control, cost and risk Retains strategic benefits of 100% in-house model Mitigates need to share intellectual property Investment in solvency capital assures re-insurers, supporting access to competitive rates Mitigates risk and limits capital exposure in a cost effective manner Shared capital and risk model
Competitive advantage through unique insights, risk-modelling and pricing agility Agile data, analysis and pricing model
Internal AA data External Data
Advanced analytics platform
Unique breakdown and Membership data Consolidating broader data sources that exist in the AA New scoring models, also supporting management information and decision making Enrich analysis through addition of external public and government databases Enhance with additional vendor data sources to provide unique blend and granular insights
Broker and insurer systems setup
Customer
Broker IT system
AA quote and policy administration system Broker pricing Data enrichment
Insurer IT system
AA insurer quotes Insurer pricing Data enrichment + analytics Policy and claims administration system
Craig Staniland CEO
30+ years experience in Insurance Previously MD, AXA Personal Lines Prior to that Founding Underwriting Director, Swiftcover and Head of Motor Underwriting, RBS
Dominic Bird, Head of Pricing
10 years experience in Insurance Previously Head of New Business Pricing, Direct Line Group Prior to that Consultant, Towers Watson
Steve Gaywood, Head of Counter-Fraud
15 yrs Counter-Fraud experience Previously Head of Counter-Fraud, AXA Personal Lines and Head of Systems and Data Analytics, Innovation Conversant Data
Tony Peppard Head of Claims
30+ years Claims and Vehicle Management experience Previously MD, AXA and Swiftcover Claims and MD, Churchill Claims Services Group
Significant scale and experience as motor and home insurance broker Market conditions and model have led to customer decline AA brand and proprietary customer data provide a competitive advantage that has not been fully utilised to date New broker PLUS insurer model designed to capitalise on opportunity through more agile and competitive pricing Capital sharing model mitigates risks while retaining strategic control Experienced team building new capabilities and systems
A great, robust business, with strong assets at the core Work on the new AA has begun, after a period of under-investment Reshaped team and strategy for the future in place Near term focus on delivering IT and digital transformation Refinancing reduces interest cost by c£47m and enables payment of dividends Period of investment now to return the AA to growth in the medium-term
Two of the UK’s most recognised brands c2,700 franchised instructors c500k police courses delivered pa Long-term contracts with police forces The clear leader across its markets UK’s largest driving school and trainer
No 1 driving school with c11% share No 1 leader in driver awareness schemes No1 c40% share
management training
Driver awareness schemes Training on fleet management
Driving Schools DriveTech
Resilient despite tough economic conditions Profitability under pressure from FX rates Roadside Assistance delivered by mix of AA Patrols and 3rd parties in remote areas Insurance sourced from underwriting panel Home Emergency launched in 2012 - the AA ‘creating the market’
Business in Ireland Ireland revenue
Breakdown of total FY15 revenue (£39m)
Present in Ireland since 1910
Roadside Assistance 52% Insurance 47% Other 1%
Roadside Assistance (£m) Insurance Services (£m) Driving Services (£m) Ireland (£m)
697 713 728 323 348 359 200 400 600 800 FY13A FY14A FY15A Revenue Trading EBITDA
Trading EBITDA margin (%)
46.3% 48.9% 49.3% 162 149 142 93 89 84 50 100 150 200 FY13A FY14A FY15A Revenue Trading EBITDA
Trading EBITDA margin (%)
57.4% 60.0% 58.9% 74 73 74 14 16 20 20 40 60 80 100 FY13A FY14A FY15A Revenue Trading EBITDA
Trading EBITDA margin (%)
19.2% 21.5% 27.7% 38 40 39 13 15 15 10 20 30 40 50 FY13A FY14A FY15A Revenue Trading EBITDA
Trading EBITDA margin (%)
33.9% 37.9% 38.2%
1 During the year ended 31 January 2015, our Media Business was transferred from Driving Services to Roadside Assistance. As a result, the results for the year ended 31 January 2014 have been restated to show the results of Media within the Roadside Assistance segment. The results for the year ended 31 January 2013 have not been restated.