
SLIDE 1
Introduction Grant Williams - Head of Fleet Management GS Plus Ltd - - PowerPoint PPT Presentation
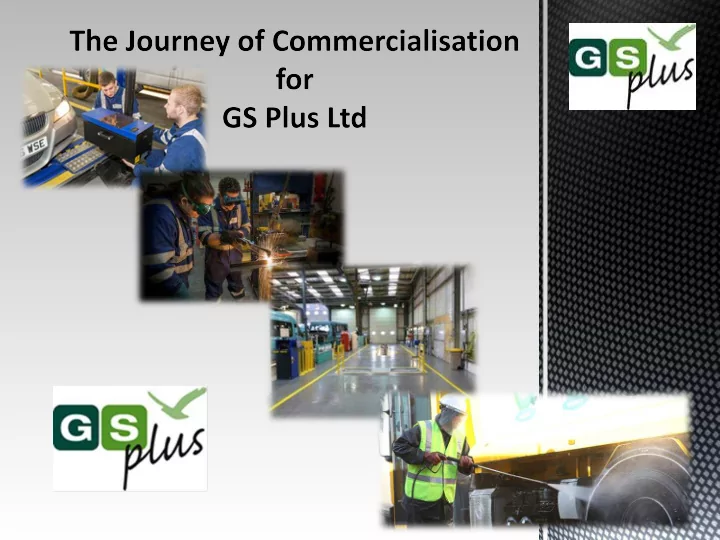
Introduction Grant Williams - Head of Fleet Management GS Plus Ltd Introduction We are a wholly owned by the Royal Borough of Greenwich We commenced operating on 1 st Feb 2010 We are a Teckal Company - 80 Council/Borough Work - 20% Commercial
Grant Williams - Head of Fleet Management GS Plus Ltd
Introduction We are a wholly owned by the Royal Borough of Greenwich We commenced operating on 1st Feb 2010 We are a Teckal Company - 80 Council/Borough Work - 20% Commercial Work Scope of our service - The scheduled and unscheduled inspection, servicing and repair of vehicles and plant. The provisions of a contract hire service for vehicles and grounds maintenance plant. The spot hire of vehicles & accident repair management. Service Stats
Exploring External Income Streams
The Journey:- 1st thing - Do you have product to sell? Do you have USP unique selling point? Know your strengths - Expand what you’re good at Research your local region - know who your competitors are! Business Plans – Consultants can be useful. Marketing/Advertising – Where, how, when. If you’re going to external procure a business - do your due diligence (Political, Economic, social, Technological, Legal & environmental) Tendering - Go through Rigorous Bid or no bid process & double check the finances Profit margins – Never what you project from a new business Rule of thumb “would you actually procure that business with your own money” Business Purchase - If it looks too good to be true then it probably is !!! Prioritise – You may have more than one business stream that is ripe for commercialisation so ensure you have the time to make it work as you planned !
ATF:
Steam Cleaning:
Body Repair Company Acquisition
Plant and equipment:
Knowing Your Customer
don’t get
define but when you receive it you know it!
Marketing
delivered with local papers & intranet used to advertise special offers for staff.
field instils confidence in potential customer
Future Options we are looking @: Taco Centre – Application, civil works, authorisation. Air-con regenerations – Equipment, training, H&S Further Expansion of the Vehicle Body Repair Operation – Larger premises, building and planning permission, project management, budget New Technology Electric Vehicles – Charging Points Driverless Vehicles – Data collection, servicing & maintenance of vehicles Telematics – Driver behaviours
END
www.apse.org.uk
www.apse.org.uk
www.apse.org.uk
www.apse.org.uk
www.apse.org.uk
www.apse.org.uk
www.apse.org.uk
Richard Clarke, Jess Wiles, Nigel Symonds 03/10/2016 APSE Meeting
accreditation as a catalyst for change
quality, to improve efficiency and enhance customer service
“The Fleet Operator Recognition Scheme (FORS) is an accreditation scheme that aims to improve fleet activity in London and throughout the UK and beyond.” Focus on:
height etc
Drivers Vehicles Operations Management
companies nationwide: ~3,582 Bronze ~516 Silver ~156 Gold
Management Vehicles Drivers Operations Policies and procedures manual Inspection and maintenance plan Licensing and qualifications Routing and scheduling Responsibilities and accountabilities Daily walk around check Driving standards Specialist goods Responsible person Fuel and tyre usage Staff training Incidents / collisions Regulatory licensing Insurance In-vehicle technology Insurance claims Communication Vehicle Excise Duty Health and safety Review Safe loading Driver fitness /health Change Vulnerable road user safety Drivers’ hours and working time Complaints Working at height Monitoring driving Resourcing Vehicle manoeuvring Updates
Silver Progression Gold Progression Maintain bronze Maintain silver Driver licensing Promoting FORS Standards Vehicle warning equipment Published case study Blind-spot minimisation Performance measurement Driver training Staff training Transport related fines and charges Fuel and emissions champion Performance measurement
Cost:
years, plus £100 for annual silver/ gold audit BUT no fee as promote FORS through our supply chain e.g. work related road risk (WRRR) requirements
already fitted ~£1200 per Large Vehicle
Resource:
audits
every few years
from collisions/ fuel usage/ fines and charges…
4 (reduced congestion, movement of goods and people)
(FORS Bronze, vehicle equipment etc)
in procurement and planning. Camden CLOCS champion
that FORS operators have:
charges
environmental performance and efficiency, with over 4,000 operators actively involved.
from improved ways of working, to reduced fines and charges, as well as a number of challenges.
training across the organisation, plus nuances of local authority fleets, at a time
Richard Clarke richard.clarke@camden.gov.uk Jess Wiles jessica.wiles@camden.gov.uk Further information:
http://www.camden.gov.uk/ccm/navigation/transport-and-streets/passenger- and-accessible-transport/
www.apse.org.uk
www.apse.org.uk
www.apse.org.uk
www.apse.org.uk
www.apse.org.uk
Efficiency Innovation Income Generation Demand Management
Association for Public Service Excellence 2nd floor Washbrook House, Lancastrian Office Centre, Talbot Road, Old Trafford, Manchester M32 0FP. telephone: 0161 772 1810 fax: 0161 772 1811 web:www.apse.org.uk
www.apse.org.uk
www.apse.org.uk
www.apse.org.uk
www.apse.org.uk
www.apse.org.uk
www.apse.org.uk
www.apse.org.uk
Richard Clarke, Jess Wiles, Nigel Symonds 03/10/2016 APSE Meeting
accreditation as a catalyst for change
quality, to improve efficiency and enhance customer service
“The Fleet Operator Recognition Scheme (FORS) is an accreditation scheme that aims to improve fleet activity in London and throughout the UK and beyond.” Focus on:
height etc
Drivers Vehicles Operations Management
companies nationwide: ~3,582 Bronze ~516 Silver ~156 Gold
Management Vehicles Drivers Operations Policies and procedures manual Inspection and maintenance plan Licensing and qualifications Routing and scheduling Responsibilities and accountabilities Daily walk around check Driving standards Specialist goods Responsible person Fuel and tyre usage Staff training Incidents / collisions Regulatory licensing Insurance In-vehicle technology Insurance claims Communication Vehicle Excise Duty Health and safety Review Safe loading Driver fitness /health Change Vulnerable road user safety Drivers’ hours and working time Complaints Working at height Monitoring driving Resourcing Vehicle manoeuvring Updates
Silver Progression Gold Progression Maintain bronze Maintain silver Driver licensing Promoting FORS Standards Vehicle warning equipment Published case study Blind-spot minimisation Performance measurement Driver training Staff training Transport related fines and charges Fuel and emissions champion Performance measurement
Cost:
years, plus £100 for annual silver/ gold audit BUT no fee as promote FORS through our supply chain e.g. work related road risk (WRRR) requirements
already fitted ~£1200 per Large Vehicle
Resource:
audits
every few years
from collisions/ fuel usage/ fines and charges…
4 (reduced congestion, movement of goods and people)
(FORS Bronze, vehicle equipment etc)
in procurement and planning. Camden CLOCS champion
that FORS operators have:
charges
environmental performance and efficiency, with over 4,000 operators actively involved.
from improved ways of working, to reduced fines and charges, as well as a number of challenges.
training across the organisation, plus nuances of local authority fleets, at a time
Richard Clarke richard.clarke@camden.gov.uk Jess Wiles jessica.wiles@camden.gov.uk Further information:
http://www.camden.gov.uk/ccm/navigation/transport-and-streets/passenger- and-accessible-transport/
www.apse.org.uk
www.apse.org.uk
www.apse.org.uk
www.apse.org.uk
www.apse.org.uk
Efficiency Innovation Income Generation Demand Management