
SLIDE 1
CPB Netherlands Bureau for Economic Policy Analysis
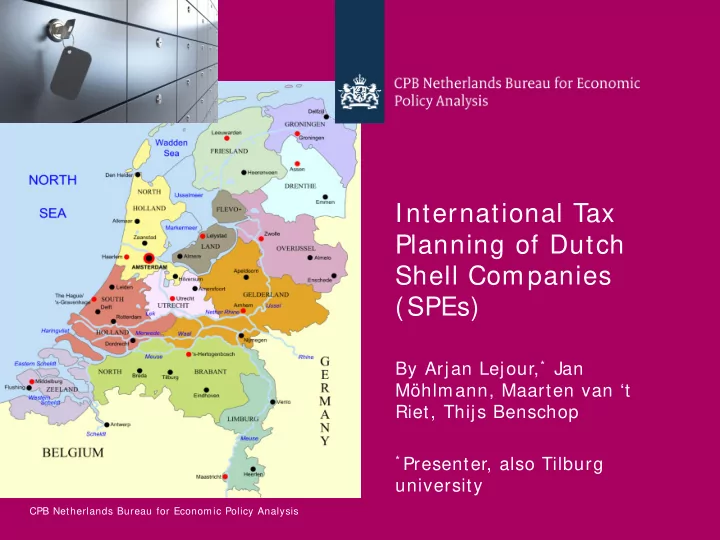
International Tax Planning of Dutch Shell Companies (SPEs)
By Arjan Lejour,* Jan Möhlmann, Maarten van ‘t Riet, Thijs Benschop
* Presenter, also Tilburg
International Tax Planning of Dutch Shell Companies (SPEs) By - - PowerPoint PPT Presentation
International Tax Planning of Dutch Shell Companies (SPEs) By Arjan Lejour, * Jan Mhlmann, Maarten van t Riet, Thijs Benschop * Presenter, also Tilburg university CPB Netherlands Bureau for Economic Policy Analysis The Netherlands:
CPB Netherlands Bureau for Economic Policy Analysis
* Presenter, also Tilburg
CPB Netherlands Bureau for Economic Policy Analysis
17 November 2018 The Dutch SPEs and Tax Planning 2
CPB Netherlands Bureau for Economic Policy Analysis
17 November 2018 The Dutch SPEs and Tax Planning 3 500 1000 1500 2000 2500 3000 3500 4000 4500 Total foreign assets (x billion euro) Sample Population
CPB Netherlands Bureau for Economic Policy Analysis
17 November 2018 The Dutch SPEs and Tax Planning 4 20 40 60 80 100 120 140 160 180 200 2004 2009 2013 2016 Other income Royalties Payments from securities Interest from other loans Dividend from affiliates 20 40 60 80 100 120 140 160 2004 2009 2013 2016 Other costs Royalties Payments on securities Interest on other loans Dividend to affiliates
CPB Netherlands Bureau for Economic Policy Analysis
17 November 2018 The Dutch SPEs and Tax Planning 5
CPB Netherlands Bureau for Economic Policy Analysis
17 November 2018 The Dutch SPEs and Tax Planning 6
CPB Netherlands Bureau for Economic Policy Analysis
17 November 2018 The Dutch SPEs and Tax Planning 7
CPB Netherlands Bureau for Economic Policy Analysis
17 November 2018 The Dutch SPEs and Tax Planning 8
CPB Netherlands Bureau for Economic Policy Analysis
17 November 2018 The Dutch SPEs and Tax Planning 9
dividend direct dividend via NLD interest direct interest via NLD royalties direct royalties via NLD
CPB Netherlands Bureau for Economic Policy Analysis
17 November 2018 The Dutch SPEs and Tax Planning 10
1 2 3 1 2 3 ijt it jt ij it jt ijt t ijt
CPB Netherlands Bureau for Economic Policy Analysis
17 November 2018 The Dutch SPEs and Tax Planning 11
CPB Netherlands Bureau for Economic Policy Analysis
17 November 2018 The Dutch SPEs and Tax Planning 12
CPB Netherlands Bureau for Economic Policy Analysis
17 November 2018 The Dutch SPEs and Tax Planning 13