
SLIDE 1
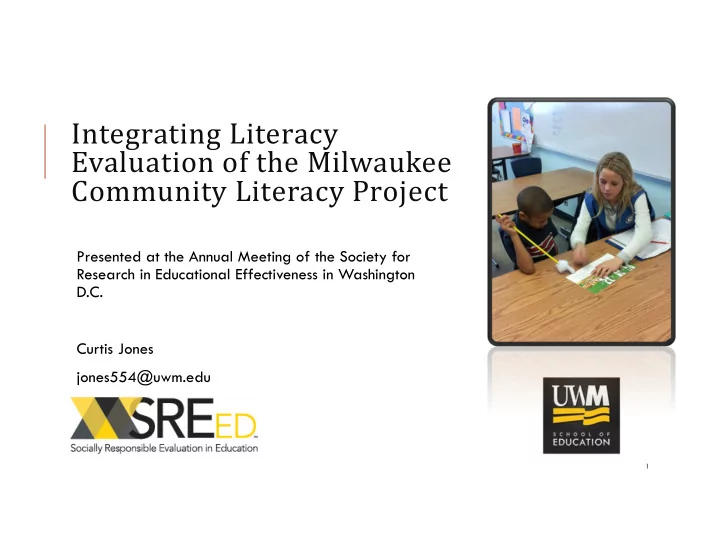
Integrating Literacy Evaluation of the Milwaukee Community Literacy Project
- !"#
Integrating Literacy Evaluation of the Milwaukee Community Literacy - - PowerPoint PPT Presentation
Integrating Literacy Evaluation of the Milwaukee Community Literacy Project
Students are pulled out of non-core classes and taken to SPARK room. Start with familiar activity. Running record assessment. Word play - Students receive instruction using Word Sorts and Making Words. Word Sorts involve students sorting words into categories to increase their understanding of sounds and letters. Making Words involves students using letters to make words so students learn how the sounds of language are put together. Reading a book at instructional level. Writing sentences - Elkonin boxes are a central piece of SPARK writing and used to help students encode words. End with tutor read aloud.
$% $&' ()* +,%'-.% * &/%'+, "0* &/ '& ( )*
7
/% /%', ()* &$' / * 111'1" 0* 111'1 ()*
& & &'+ ()*
*
"0*
( )*
&- &,'- ()*
*
"0*
( )*