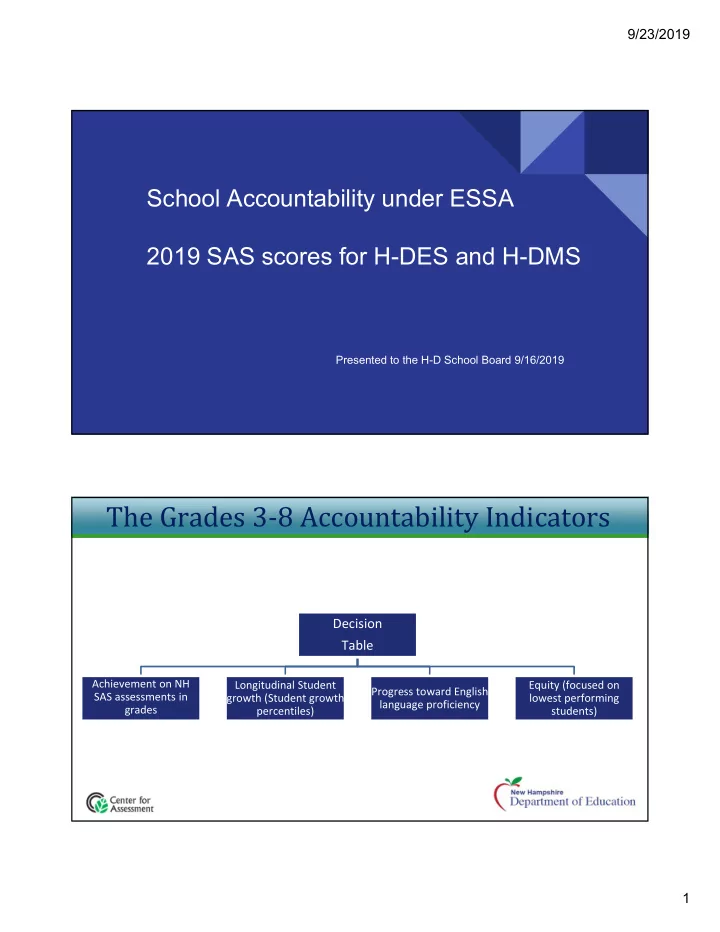

9/23/2019 School Accountability under ESSA 2019 SAS scores for H-DES and H-DMS Presented to the H-D School Board 9/16/2019 The Grades 3‐8 Accountability Indicators Decision Table Achievement on NH Longitudinal Student Equity (focused on Progress toward English SAS assessments in growth (Student growth lowest performing language proficiency grades percentiles) students) 3 ‐ 8 in Math and ELA 1
9/23/2019 School Identification Comprehensive Support and Improvement (CSI) • The lowest performing 5% of Title 1 schools Additional Targeted Support (ATS) • A school is identified if it has a subgroup that, if on its own, would be identified if the CSI criteria were applied. • If schools do not exit this status within 4 years, they will be reclassified as CSI. Targeted Support and Improvement (TSI) • Bottom 5% of schools based on each subgroup’s performance for every indicator. • Not identified until Fall 2019 Not Identified May 2019 (Grade 3) Class of 2028 P+ Average �� ���� � �� � Scale Score H-D 52 429 +/-3 State 57 434 +/-0 April 2018 (Grade 3) May 2019 (Grade 4) Class of 2027 P+ Average P+ Average Cohort % Change from previous year Scale Score Scale Score -13 H-D 30 418 +/-3 17 426 +/-4 State 55 433 +/-0 52 460 +/-0 April 2018(Grade 4) April 2019 (Grade 5) Class of 2026 P+ Average P+ Average Cohort % Change from previous year Scale Score Scale Score H-D 27 445 +/- 3 10 455 +/-4 -17 State 53 461 +/-0 43 487 +/- 0 2
9/23/2019 May 2019 (Grade 3) Class of 2028 P+ Average �� ���� ��� Scale Score H-D 50 575 +/-5 State 52 586 +/-0 April 2018 (Grade 3) May 2019 (Grade 4) Class of 2027 P+ Average P+ Average Cohort % Change from previous year Scale Score Scale Score -3 H-D 27 568 +/- 4 24 573 +/-5 State 54 588 +/-0 55 608 +/-0 April 2018 (Grade 4) April 2019 (Grade 5) Class of 2026 P+ Average P+ Average Cohort % Change from previous year Scale Score Scale Score H-D 35 587 +/-5 34 603 +/-4 -1 State 55 607 +/-0 57 625 +/-0 May 2019 (Grade 5) Class of 2026 P+ Average �� ���� ��� ���� Scale Score H-D 23 543 +/-1 State 38 549 +/-0 3
9/23/2019 April 2018 (Grade 5) May 2019 (Grade 6) Class of �� �� �� � �� � 2025 P+ Average P+ Average Scale Score Scale Score Cohort % Change from previous year H-D 18 457 +/-5 42 503 +/- 6 +24 State 45 488 +/- 0 48 512 +/-0 April 2018 (Grade 6) May 2019 (Grade 7) Class of 2024 P+ Average P+ Average Cohort % Change from previous year Scale Score Scale Score -11 H-D 34 502 +/-4 23 520 +/-5 State 46 512 +/-0 47 544 +/-1 April 2018 (Grade 7) April 2019 (Grade 8) Class of 2023 P+ Average P+ Average Cohort % Change from previous year Scale Score Scale Score H-D 24 521 +/-5 28 549 +/-8 +4 State 48 546 +/-1 45 575 +/-0 April 2018 (Grade 5) May 2019 (Grade 6) Class of �� �� �� ��� 2025 P+ Average P+ Average Scale Score Scale Score Cohort % Change from previous year H-D 47 607 +/-6 39 628 +/- 5 -8 State 61 630 +/-0 56 644 +/-0 April 2018 (Grade 6) May 2019 (Grade 7) Class of 2024 P+ Average P+ Average Cohort % Change from previous year Scale Score Scale Score +3 H-D 49 634 +/-4 52 634 +/-5 State 55 645 +/-0 57 647 +/-0 April 2018 (Grade 7) April 2019 (Grade 8) Class of 2023 P+ Average P+ Average Cohort % Change from previous year Scale Score Scale Score H-D 46 639 +/-5 44 648 +/-5 -2 State 60 652 +/-0 53 661 +/-0 4
9/23/2019 May 2019 (grade 8) Class of 2023 P+ Average �� �� �� ��� ���� Scale Score H-D 34 847 +/-2 State 39 849 +/-0 May 2019 (Grade Class of 2020 11) �� ���� ��� ���� P+ Average Scale Score H-D 35 1146 +/-2 State 41 1150 +/- 0 5
9/23/2019 Steps taken thus far: ● K-8 Math Series ○ Professional development for implementation in both June and August ● Deliberate Alignment of Standards to Daily Instruction ○ H-DES is working with West-Ed to unpack the standards and utilize specific protocols within the PLC process to ensure alignment and instructional fidelity ● Targeted Supports for Grades K-2 ● Training on the use of SAS modular and interim assessments ● Purposeful Professional Development ○ PLC protocols and process ○ Standards alignment ○ Fundations ○ Ready Math and iReady diagnostic ○ Responsive Classroom ○ Competency based instruction and assessment ● Data informed RtI model at H-DMS Moving Forward: ● K-8 Math Series ○ Continued professional development for implementation ● H-DES is continuing to work with West-Ed to unpack the standards and utilize specific protocols within the PLC process to ensure alignment and instructional fidelity ● Purposeful Professional Development ○ PLC protocols and process ○ Standards alignment ○ Fundations ○ Ready Math and iReady diagnostic ○ Responsive Classroom ○ Competency based instruction and assessment ○ Trauma informed schools ○ Motivating disengaged and disruptive students ● Expansion of Data informed RtI model at H-DMS ● Purposeful use of the interim and modular assessment at each grade level ● Continue working to integrate more inquiry based work into NGSS aligned curriculum at all grade levels 6
Recommend
More recommend