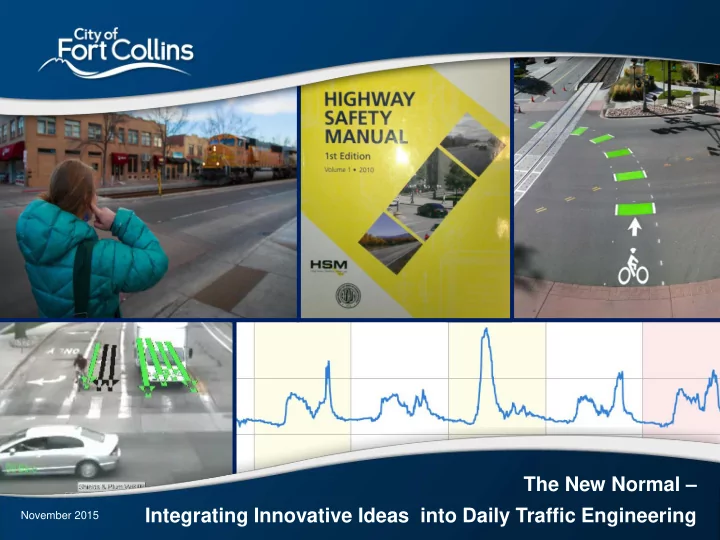
SLIDE 1 The New Normal – Integrating Innovative Ideas into Daily Traffic Engineering
November 2015
SLIDE 2 Adding New Elements To Our Work
- Bike Infrastructure
- Strengthening Traffic Safety Program
- Measuring Performance
- Railroad Quiet Zone Waiver
2
SLIDE 3 3
Bike Infrastructure
SLIDE 4 Bike Infrastructure
City of Fort Collins is one of only four Platinum Level bicycle friendly communities in the country Goal of comfortable, convenient and safe bicycling intended to increase ridership Focus on infrastructure
4
SLIDE 5
What We’re Implementing and How It’s Working Buffered/protected bike lanes Bike boxes Green markings Bike signals Bike detection ..and more
SLIDE 6 Low Stress Bike Network
6
- Leveraging overlay program
- Takes planning and coordination
- Significant staff/crew time
- Not nominal cost
- Maintenance impact unknown
SLIDE 7 Bike Detection
- Video detection
- Differentiates between
bicyclists and motorists
bikes to cross
SLIDE 8 Green Markings
- Very visible and conspicuous
- Thermoplastic or Methylmethacrylate (MMA)
- Installation and maintenance challenges
SLIDE 9 Green Markings
- Popular with cycling community but no documented
increased ridership
- Working on guidance to determine appropriate locations
SLIDE 10
Bike Crashes in Fort Collins
113 102 106 103 118 124 107 141 142 151 150 159 180 178 139 20 40 60 80 100 120 140 160 180 200
Year
SLIDE 11 Types of Bike Crashes 80% of all bike crashes
driveways.
30% of all bike crashes
involve wrong way riding Only 11% of all crashes involve sideswipe/rear end
Right Angle 54% Approach 15% Overtaking 14% Sideswipe 8% Parking 3% Rearend 3% Head On 1% Other 2%
SLIDE 12 Current Bike Implementations
Right Angle 54% Approach 15% Overtaking 14% Sideswipe 8% Parking 3% Rearend 3% Head On 1% Other 2%
Bike Box Travel Buffer Parking Buffer Travel Buffer
SLIDE 13 What is Safety?
Perceived Safety
- Protected bike lanes
- Buffers
- Green paint
- Sense of belonging
Actual Safety
intersection crashes
cyclists and drivers
riding
Needed to encourage more riders Needed to keep riders safe
SLIDE 14 Take Aways
- Committed to improving bike infrastructure and
bicyclist safety
- Traffic engineering and bicycle advocacy aren’t
always aligned.
- Challenges addressing most common crash types
- Installation and maintenance of new treatments is a
work in progress
- Staff time and resources stretched - Competing
priorities
SLIDE 15 15
Traffic Safety Program
SLIDE 16 Traffic Safety: It Begins with Good Data
- Electronic crash reports
- Read narrative and witness
statements
- Enter them into a database
- Public/Private, Injury Severity,
Intersection/Mid-Block
SLIDE 17 What are We Doing?
- Annual Safety Report
- Monitor Trends
- I.D. City-Wide Crash Patterns
- Identify High Crash Locations
Fcgov.com/traffic/safetysummary.php
SLIDE 18 What are We Doing?
- Highway Safety Manual Approach
- CDOT Safety Performance Functions
- CDOT Level of Service of Safety
18
SLIDE 19 Safety Audits (Diagnosis)
- Review crash reports and other data (volumes etc.)
- Collision Diagrams
- Pattern Recognition Algorithms
- Field Review
- Traffic Control/Signs/Markings
- Function/Operations
- Outside Input
- Citizens, Schools, Police
- Identify potential improvements
SLIDE 20
Utilizing GIS with Data
SLIDE 21
Interesting Finds
SLIDE 22
Interesting Finds
SLIDE 23
Dilemma Zone Protection
Signal Offset Adjustments Advanced Detection
SLIDE 24 How are We Doing?
24
1000 2000 3000 4000 5000 2007 2008 2009 2010 2011 2012 2013 2014
Total Crashes
100 200 300 400 2007 2008 2009 2010 2011 2012 2013 2014
Injury Crashes
2007 – 2014
- Injury Crashes down 14%
- Total Crashes up 13%
- VMT Increased 2%
SLIDE 25 Take Aways
- CDOT SPFs are a better fit
- Looking beyond high crash locations
- Low cost safety improvements can make a big difference
- Worthwhile to dig deeper
25
SLIDE 26 26
Bluetooth Performance Data
SLIDE 27 Bluetooth Performance Data
- Installed 31 bluetooth readers at
major intersections
27
SLIDE 28
Individual Pairs
SLIDE 29
Smoothed Travel Time Curve
SLIDE 30
Uses: University Impact
SLIDE 31
Uses: Long Term Construction Impact
SLIDE 32 Uses: Construction Impact by Time of Day
32
SLIDE 33 Uses: Construction Impact by Time of Day
33
SLIDE 34
Uses: Spot Improvements
SLIDE 35
Uses: Spot Improvements
SLIDE 36
Daily Variation
SLIDE 37 Take Aways
- You can’t fix what you don’t know
- Traditional methods of modeling performance may
not be calibrated very well
37
SLIDE 38 38
Railroad Quiet Zones
SLIDE 39 Railroad Quiet Zones
39
A unique urban environment with RR tracks in the center of the street
SLIDE 40 Mason Corridor Risk Indices
40
- Nationwide Significant Risk Threshold – 14,347
- Mason Risk Index with Horn – 30,930
- Mason Quiet Zone Risk Index – 51,592
Train Speed on Mason in the FRA Inventory – 49 mph Calculated 95th% Train Speed – 22 mph
SLIDE 41 Mason Corridor Risk Indices
41
From the Train Horn Rule:
"FRA rates collisions that occur at train speeds in excess of 25 mph as an Abbreviated Injury Scale (AIS) level 5 ($2,287,500) and injuries that result from collisions involving trains traveling under 25 mph as an AIS level 2 ($46,500). About half of grade crossing collisions occur at speeds greater than 25 mph. Therefore, FRA estimates that the value of preventing the average injury resulting from a grade crossing collision is $1,167,000 (the average of an AIS-5 injury and an AIS-2 injury).”
SLIDE 42 Mason Corridor Risk Indices
42
From the Train Horn Rule:
"FRA rates collisions that occur at train speeds in excess of 25 mph as an Abbreviated Injury Scale (AIS) level 5 ($2,287,500) and injuries that result from collisions involving trains traveling under 25 mph as an AIS level 2 ($46,500). About half of grade crossing collisions occur at speeds greater than 25 mph. Therefore, FRA estimates that the value of preventing the average injury resulting from a grade crossing collision is $1,167,000 (the average of an AIS-5 injury and an AIS-2 injury).”
Question: What cost should be used for an injury crash
- n a corridor where trains travel at less than 25 mph?
SLIDE 43
*Risk Index for intersections using FRA Train Horn Rule methodology and
crash cost estimates assuming $46,500 per injury crash at signalized intersections versus $1,167,000 per injury crash at grade crossings.
Location Risk Index* Injury Crashes Fatal Crashes
Nationwide Significant Risk Threshold 14,347 Mason Grade Crossing Risk Index with Horn 5,695 1 injury crash every 117 years 1 fatal crash every 711 years Mason Grade Crossing Quiet Zone Risk Index 6,799 1 injury crash every 107 years 1 fatal crash every 650 years Average Signalized Intersection in FC 191,935 3.2 injury crashes per year 1 fatal crash every 67 years
Risk Indices
SLIDE 44 Take Aways
- Train horn rule needs work
- Does not adequately consider train speeds
- Safety isn’t black and white
- May make quiet zones more realistic where train speeds
are low
44
SLIDE 45 45
Moving Forward
SLIDE 46 We’ve chosen a cautiously innovative approach
- “Safety” is complicated
- Good data is critical
- Many new opportunties
- Prioritization is challenging
46
SLIDE 47 Thank You!
City of Fort Collins Traffic Operations Department 970-221-6630 Joe Olson jolson@fcgov.com Martina Wilkinson mwilkinson@fcgov.com
47