Instruments and Collaborators: IIA (India): M. Safonova, Chinthak - - PowerPoint PPT Presentation

instruments and collaborators
SMART_READER_LITE
LIVE PREVIEW

Instruments and Collaborators: IIA (India): M. Safonova, Chinthak - - PowerPoint PPT Presentation

Unveiling the structure of progenitors of Sne-IIP through multiwaveband observations. Firoza Sutaria (Indian Institute of Astrophysics, Bangalore) SN2013ab in NGC 5669 (V), (104 cm ARIES/ST). (Chandra ACIS-I) SN2011ja SN2013ej in


slide-1
SLIDE 1

Unveiling the structure of progenitors of Sne-IIP

through multiwaveband observations.

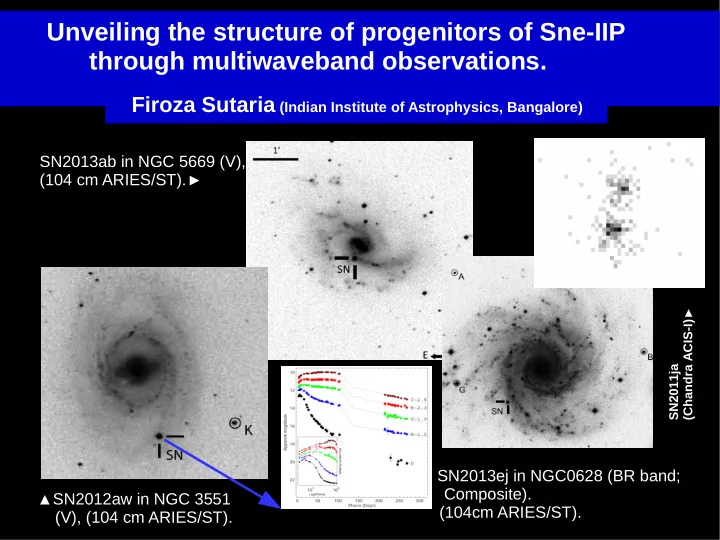
Firoza Sutaria (Indian Institute of Astrophysics, Bangalore) ▲ SN2013ej in NGC0628 (BR band; Composite). (104cm ARIES/ST). ▲SN2012aw in NGC 3551 (V), (104 cm ARIES/ST). SN2013ab in NGC 5669 (V), (104 cm ARIES/ST).►

SN2011ja (Chandra ACIS-I)►

slide-2
SLIDE 2

Instruments and Collaborators:

◄2.3m at Vainu Bappu Telescope (IIA, India) ▼1.04m ST (ARIES, India) ▲2m HCT (IIA, India). ◄Swift/UVOT IIA (India): M. Safonova, Chinthak Murali ARIES (India): S.Bose, B. Kumar, B. Kumar,

  • K. Misra, H. Chandola, M. Singh, S. Pandey

TIFR (India): S. Chakraborti, N. Yadav, A. Ray LCGOT/UCSB: S. Valenti, M. Graham, A. Howell INAF: A. Pastrorello, P. Ochner

  • U. Chicago: V. Dwarkadas, D. York
slide-3
SLIDE 3

A blast wave that lights up the past – evolution of the SN shock

  • Core rebound initiates shock wave through progenitor envelope.
  • Blast wave propagates out, sweeps up CSM / ISM material in front it.
  • Free Expansion phase (102 to 103 yr):

Supersonic, adiabatic expansion/cooling, rshock  t-3

  • Reverse shock forms at

MCSM ≃ Mejecta.;

moves inwards,

expansion slows, reheating

  • Sedov-Taylor expansion (104 yr):

Adiabatic cooling

dominates.

  • Snow plow phase: 106-109 yr

Radiative cooling dominates.

  • Mixing of ISM and ejecta

¿ρ∝t−3

ρ∝t −3

Image credit: Nymark, Fransson & Kozma, 2006, A &A

slide-4
SLIDE 4

Tracks:

  • Various nuclear burning stages
  • How / why was material ejected from progenitor

– LBV (2009ip) ? – Pair instability (2006gy, 2007bi) ? – Red Super Giant (RSG)?

  • The mass of the progenitor.
  • Metallicity of the progenitor.

CSM as fossil evidence of progenitor evolution Supernovae responsible for dusty Universe?

  • Nucleosynthesis & recycling of heavy elements.
  • Massive progentiors (M > 8 M⊙) ⇒ Large mass loss (dusty CSM?)

+ Short lifetimes, + dust production before / during / after explosion?

  • Source of dust (≥ 108 M⊙) in high z (≥ 6) galaxies?
  • If typical Mdust ~ 10-2 M⊙, what is the primordial

star formation rate?

slide-5
SLIDE 5

SNe-IIP and SNe-IIL – extreme ends of a single class?

SN2012aw: Early detection (max. 48 hrs after shock breakout), Early identification, Bright (peak MV= -18.3) Early X-ray + Early radio emission Continuum polarized at level of 0.3% ⇒ substantial asymmetry in outer ejecta. HST archival images set Mprog < 15.5 M⊙. SN2013ab: Early detection (max 60 hrs after shock breakout), Early identification, Bright ( peak MV= -17.4), No early (or late time) X-ray or Radio emission. No archival observations to estimate Mprog. SN2013ej: Early detection (max. 14 hrs after shock breakout), Early identification, Bright ( peak MV= -17.5), Early X-ray emission, HST archival images set 8 < Mprog < 15.5 M⊙.

slide-6
SLIDE 6

Tracing the reverse shock: X-ray observations of Sne-IIP 2011ja and 2013ej: ◄▲SN2013ej at 5 epochs.

(Chakraborti... Sutaria... etal, 2015, ApJ, in prep.)

Prompt X-ray emission observed from both 2011ja and 2013ej.

SN2013ej: Prolonged X-ray emission, from 12d to 145d post explosion in SN2013ej. SN2013ej: (0.3-8) keV flux drops from 9×10-15 erg/cm2/s to ~4×10-15 erg/cm2/s. SN2011ja: Prolonged X-ray emission, from 18d post explosion to 113 d post explosion. SN2011ja: (0.3-8) keV flux increases from 9.8×10⁻¹⁵ erg/cm2/s to ~4.08×10⁻¹⁴ erg/cm2/s. Multicomponent X-ray emission:

  • Forward shock (~100 keV) when

ejecta plows in to CSM.

  • Reverse shock (~1 keV) when the
  • utflow is decelerated by the CSM

pressure.

  • Model consists of self-absorbed,

hot, Plasma + thermal bremms. + Inverse Compton process. Progenitor of 2013ej: ZAMS mass M = 13.3 ±0,3 M⊙.

slide-7
SLIDE 7

Evidence of CSM interaction in Radio and X-rays

Type IIP SN2011ja : X-ray + Radio observations at up to 84 d post-explosion ⇒CSM bubbles caused by the hot progenitor wind, or progenitors with episodic mass loss. (Chakraborti...Sutaria et al. 2013) Type IIP SN2012aw: Radio (GMRT, up to 184 days after explosion) + optical: Rare case of Compton cooling dominating over Synchrotron self absorption (SSA) in the CSM. Possibly due to a progenitor with low mass loss rate 1.9 x 10⁻⁶ M⊙/yr. (Yadav...Sutaria et al. 2014)

SN2011ja: ZAMS and wind mass- loss rate (last 100 yr) for MESA runs (magenta), and theoretical line (blue) (Nieuwenhuijzen & de Jager 1990; R = 103 R) plotted for

  • comparison. Shaded boxes are 1σ

confjdence intervals for the mass- loss rate observed in SN 2011ja (corresponding to B = 0.1) fjrst epoch (red), second epoch (green), and SN2004dj from Chakraborti et

  • al. (2012) (gray). Progenitor

possibly underwent variable mass loss during the fjnal phases of stellar evolution.

slide-8
SLIDE 8

▲Comparison of early (8d),

plateau (31d, 74d) and nebular (174d) phase spectra of SN 2013ab with other well-studied type IIP SN 2012aw, SNe 1999em , 1999gi and 2004et.

Bose et al. 2014)

Evidence of early CSM interaction in SNe-IIP

◄Comparison of H-α line velocities in SN2013ej. An additional feature (marked A) appears at ~ 108 d, corresponding to the start of the nebular phase.

12.1d 35.0d 42.1d 68.0d 71.1d 79.5d 96.1d 97.0d 108.9d 125.0d 138.0d

slide-9
SLIDE 9

A look at the light curves:

SN2012aw in UBVRI. SN1999em in grey lines. Inset: Early time evolution

  • f 2012aw with the evolution of

Primary and Secondary peaks marked.▼ ▲SN2013ej UBVRI + Swift u, b, uvw1, uvm2, uvw2. ▲SN2013ab UBVRI and Swift/UVOT light curves.

slide-10
SLIDE 10

Comparing MV & Mbol:

▲Comparing the absolute mag. (MV)

  • f SN2012aw, 2013ab and 2013ej.

The bolometric light curves across various SNe-II.▼

slide-11
SLIDE 11

... and colors...

▲Color evolution of 2012aw, 2013ab and 2013ej compared with that for SN1999em and SN2004et. ▼ Temporal evolution of Tphot & Rphot from BB fits to observed fluxes from 170 to 880 nm. 2012aw 2013ab The outward moving SNe- shock, and The inward moving recombination front reveal themselves...

slide-12
SLIDE 12

Spectral analysis:

▼SN2012aw: (A) High velocity He I at 17665 km/s on 7 d slows down to 16643 km/s on 8d. (B) HV H-β feature also slows From 21785 km/s to 21477 km/s. (C) HV feature of H-β blended with Ba II and Sc II lines on 104 d. ◄SN2013ab: No HV features in spectra. SN2013ej: H-α at ~108 d shows signs of CSM Interaction.►

slide-13
SLIDE 13

Comparing spectra at similar epochs.

1999gi data from Leonard et al. 2002, ApJ, 124. 1999em data from Leonard et al. 2002, PASP,114. 2004et data from Sahu et al. 2006, MNRAS, 372.

SN 2013ej:

  • Dip in H-alpha at 6170 A.

Si II (6347, 6371 A)? Early CSM interaction? Also seen at 35d, 45d.

  • Modelled by SYNOW as Si II

feature. SN2013ab: No unusual feature. SN2012aw:

  • NII lines (4623, 5679 A) seen at

8 d, disappear by 12d. No HV features present in 1999em and 1999gi at 60d -- HV features present in 2012aw, Similar to that 2004et. HV Features often emerge at start of Nebular phase.

slide-14
SLIDE 14

Spectral Evolution of SN2013ab. Spectra at Extreme blue and red ends have poor S/N. ► ▲Comparison of spectra at select epochs For SNe 13ab, 12aw, 99em, 04et, 99gi.

slide-15
SLIDE 15

▲SYNOW chi-by-eye fits to Fe-II (l) and H-alpha(r) Profiles in the case of SN2013ej.

◄Evolution of the H-alpha profile of SN2013ej.

The evolution of line profiles: SN2013ej

slide-16
SLIDE 16

SN2013ab: Evolution of the line profiles of SN2013ab, for the H-β, NaI D and H-α. ►

SN2012aw: The evolution of line profiles

H-β, NaI D, Ba II and H-α. The phases are 7, 8, 12, 15, 16, 20, 26, 31, 45, 55, 61, 66, 104 and 270 d (top to bottom).

The evolution of line profiles: SN2013ab and 2012aw

slide-17
SLIDE 17

Top: vph from FeII at late phases & HeI at early phases) Center: P-cygni absorption trough Velocity from H-α Bottom: P-cygni absorption trough Velocity from H-β. Comparing the ''photospheric'' velocities: Velocities estimated from SYNOW (Sobolev approximation) models, No HV features included. Direct measurements: from Fe II (4924, 5069, 5169 A) from H-α, H-β absorption features.

slide-18
SLIDE 18

▲Line velocities for SN2012aw, measured from absorption troughs of various spectral features & from SYNOW.

More velocity comparisons:

▼Line velocities for SN2013ab, measured from absorption troughs of various spectral features, and from SYNOW.

slide-19
SLIDE 19

Results, conclusions and points to ponder:

  • The emergence of very bright SNe, even in the “isolated progenitor” class.

New mechanisms for mass loss? Modelling of the light curves and spectra suggests that:

  • SN2012aw is a super luminous SN-IIP with ~15 M⊙ progenitor, which

underwent extensive and episodic mass loss in the late evolutionary stage. Explosion energy is 1-2 f.o.e., and MNi=0.06 Msun.

  • SN 2013ab reveals itself as "typical" event with ~9 M⊙ progenitor with a highly

extended envelope (~ 600 R⊙).

  • SN2013ej, which was identified as a type-IIP early in its evolution, shows up

as transitionary event between classes, as it shows late time characteristics of Sne-IIL. HV features near nebular stage suggest possible bipolar distribution of

  • 56Ni. X-ray evidence of circumstellar interaction at late stages. Progenitor

ZAMS ~14 M , ~450 R and explosion with 2.3 f.o.e. ⊙ ⊙ Events like SN2013ej, SN2011ja demonstrate the need for spectral followup of SNe at several epochs, especially when classifying events for the determination

  • f the cosmological SNe rate, as a function of the supernova type.
slide-20
SLIDE 20

Merci beaucoup, IAU!