
SLIDE 1
Input-output-based life cycle assessment of the wood construction - - PowerPoint PPT Presentation
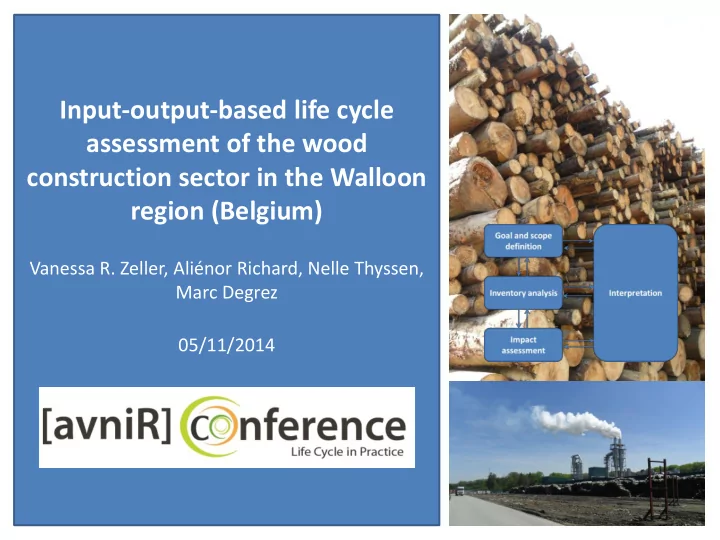
Input-output-based life cycle assessment of the wood construction sector in the Walloon region (Belgium) Vanessa R. Zeller, Alinor Richard, Nelle Thyssen, Marc Degrez 05/11/2014 Introduction Walloon region (Belgium) Regional
Project framework
impacts of the wood construction sector in the Walloon region
2
Method
level
Walloon region (Belgium)
the Belgian and 60 % higher than the EU average*
impacts
*State of the Environment Directorate, and SPW - DGO3 - DEMNA - DEE. 2012. Key Environmental Indicators for Wallonia in 2012 (KEIW 2012). Status and Outlook Reports.
3
(Dietzenbacher et al. 2013) and GTAP-MRIO (Andrew and Peters 2013)
25, no. 1, pp. 99–121, 2013.
4 (3) Input-output analysis 𝑦 = (𝐽 − 𝑎)−1𝑧 𝑓 = 𝐶(𝐽 − 𝑎)−1𝑧 (4) Impact assessment (2) Development of environmentally extended input-output tables Inventory results
land use)
(6) Scenario analysis
(1) Data collection
Development of the model
sectors)
Modelling trade
Analyses/Application
→Priority setting environmental policy (5) Baseline
→Support decision-making
5 (3) Input-output analysis 𝑦 = (𝐽 − 𝑎)−1𝑧 𝑓 = 𝐶(𝐽 − 𝑎)−1𝑧 (4) Impact assessment (2) Development of environmentally extended input-output tables Inventory results
land use)
(6) Scenario analysis
(1) Data collection
Development of the model
sectors)
Modelling trade
Analyses/Application
→Priority setting environmental policy (5) Baseline
→Support decision-making
6
Economic data
Walloon region, 2003 (M€)
Supply table
Walloon region, 2003 (M€) (1) Data collection
Environmental data
Avonds, Luc. 2008. Evaluation d’un cadre entrées-sorties régional pour la Belgique. Planning & Working Papers Working Paper 18-08. Bureau fédérale du Plan.
Products Economic activities
NACE 01-05 NACE 10-45 NACE 50-95 Total
CPA 01-05 1.922 5 50 1.977 1.132 67 3.176 CPA 10-45 35 43.964 1.955 45.954 32.387 5.255 83.596 CPA 50-95 3 1.625 68.419 70.047 5.049 11.391 86.487 Total economic activity 1.960 45.594 70.424 117.978 38.568 16.713 173.259 NACE 01-05 NACE 10-45 NACE 50-95 Total Households Fixed capital formation Exports Total products CPA 01-05 99 1.054 122 1.275 654 37 1.209 3.175 CPA 10-45 664 20.209 7.665 28.538 12.000 8.637 34.419 83.594 CPA 50-95 378 10.027 18.707 29.112 44.947 1.843 10.584 86.486 Total 1.141 31.290 26.494 58.925 57.601 10.517 46.212 173.255 Net taxes 20 111 1.413 1.544 5.010 1.268 59 7.881 Gross value added 798 14.192 42.517 57.507 Total economic activity 1.959 45.593 70.424 117.976 CH4 (t) 92.010 8.983 9.593 110.586 3.728 114.314 N2O (t) 7.920 3.142 1.157 12.219 471 12.690 CO2 (t) 361.253 27.892.832 6.757.857 35.011.943 11.356.350 46.368.293
Emissions
7
(2) Development of environmentally extended input-output tables Z = (U − V′OD)V′D
−1 Z= Input-output table OD= Off-diagonals D= Diagonal entries
NACE 01-05 NACE 10-45 NACE 50-95 Total Households Fixed capital formation Exports Total products CPA 01-05 99 1.054 122 1.275 654 37 1.209 3.175 CPA 10-45 664 20.209 7.665 28.538 12.000 8.637 34.419 83.594 CPA 50-95 378 10.027 18.707 29.112 44.947 1.843 10.584 86.486 Total 1.141 31.290 26.494 58.925 57.601 10.517 46.212 173.255 Net taxes 20 111 1.413 1.544 5.010 1.268 59 7.881 Gross value added 798 14.192 42.517 57.507 Total economic activity 1.959 45.593 70.424 117.976 CH4 (t) 92.010 8.983 9.593 110.586 3.728 114.314 N2O (t) 7.920 3.142 1.157 12.219 471 12.690 CO2 (t) 361.253 27.892.832 6.757.857 35.011.943 11.356.350 46.368.293 NACE 01-05 NACE 10-45 NACE 50-95 Total
CPA 01-05 1.922 5 50 1.977 1.132 67 3.176 CPA 10-45 35 43.964 1.955 45.954 32.387 5.255 83.596 CPA 50-95 3 1.625 68.419 70.047 5.049 11.391 86.487 Total economic activity 1.960 45.594 70.424 117.978 38.568 16.713 173.259
Supply table (V’) Use table (U)
8
(3) Input-output analysis
𝑦 = (𝐽 − 𝑎)−1𝑧 𝑓 = 𝐶(𝐽 − Z)−1𝑧
CPA 01-05 CPA 10-45 CPA 50-95 CPA 01-05 0,05 0,02 0,00 CPA 10-45 0,33 0,46 0,08 CPA 50-95 0,20 0,19 0,27 CH (t) 47,87 0,20 0,14 CPA 01-05 CPA 10-45 CPA 50-95 CPA 01-05 1,07 0,05 0,01 CPA 10-45 0,72 1,96 0,23 CPA 50-95 0,48 0,53 1,44
Emission matrix (B) Input-output table (Z)
products
(4) Impact assessment
CML 2 baseline 2000 methodology (April 2013)
CH4 (t) 47,87 0,20 0,14 N2O (t) 4,12 0,07 0,02 CO2 (t) 187,96 634,45 98,77
Leontief inverse (I-Z)-1
x = Total demand e= Environmental intervention B= environmental intervention matrix
9
Air emission kg/M€ Air emission kg/M€ NH3 48 NO2 1.669 CO2 397.906 NMVOC 1873 CO 2763 PM 10 167 N2O 103 PM 2.5 143 CH4 329 SO2 516 Global warming potential (100 y.) 436872 kg CO2-eq./ M€ Human toxicity 2312 kg 1.4-DB-eq./ M€ Photochemical
148 kg C2H4-eq./ M€ Acidification 1530 kg SO2-eq./ M€ Eutrophication 262 kg PO4-eq./ M€
Contribution analysis (%) for global warming potential of wood building products produced in Walloon region
500 1000 1500 2000 2500 3000
Global warming potential (t CO2-eq./M€)
10
11
12