Indoor Positioning Thesis Interface P r o f e s s o r B o b K e s - - PowerPoint PPT Presentation

indoor positioning thesis interface
SMART_READER_LITE
LIVE PREVIEW

Indoor Positioning Thesis Interface P r o f e s s o r B o b K e s - - PowerPoint PPT Presentation

Indoor Positioning Thesis Interface P r o f e s s o r B o b K e s s l e r 's P e r s o n i n b u i l d i n g t r a c k e r A g e n t a k a : I P A L ( I n d o o r P o s i ti o n i n g A g e n t L o c a to r ) S y s t e m E n g i n e


slide-1
SLIDE 1

Indoor Positioning Thesis Interface

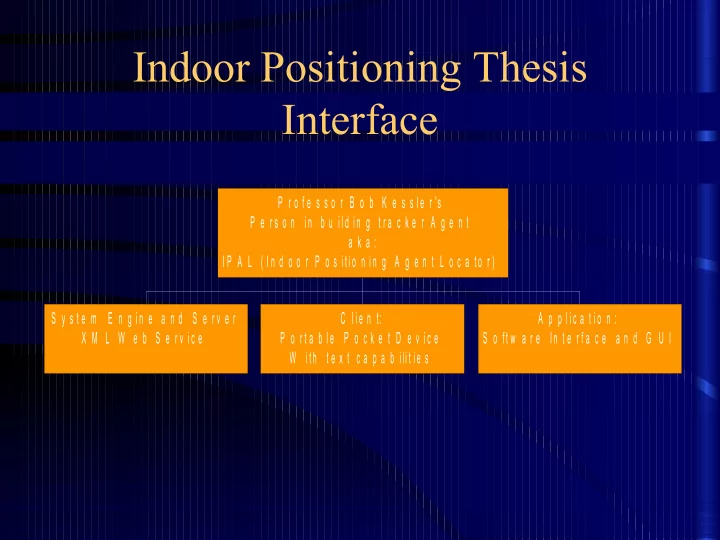
S y s t e m E n g i n e a n d S e r v e r X M L W e b S e r v i c e C l i e n t: P o r t a b l e P o c k e t D e v i c e W i th t e x t c a p a b i li t i e s A p p l i c a t i o n : S o ft w a r e In t e r f a c e a n d G U I P r o f e s s o r B o b K e s s l e r 's P e r s o n i n b u i l d i n g t r a c k e r A g e n t a k a : I P A L ( I n d o o r P o s i ti o n i n g A g e n t L o c a to r )

slide-2
SLIDE 2

IEEE 802.11 IPAL Proposal

  • Existing Infrastructure
  • Industry Standard IEEE Interface
  • Built in support for additional COM features
slide-3
SLIDE 3

Application Server or Engine

Provides all background mathematical calculations needed to determine location.

  • SQL Server Database

Input and output communication with server is accomplished using:

  • Microsoft SOAP, an XML compliant “Web Service”
  • Standard XML Agent Communication Language
  • therwise known as ACL.
slide-4
SLIDE 4

Graphical User Interface

  • A Macromedia GUI providing new client

setup and calibration

  • Communicates with Application Server

using XML

  • Location of a person or node from any web

browser with flash reader installed

  • And other possible features, such as a site

map, that may prove useful

slide-5
SLIDE 5

Signal Strength View displays the strongest RSSI at each location for the selected access points. The dotted line is the recorded site survey route. The grid lines are also turned on to see the accuracy of the visualization. [Ekahau, Inc]

slide-6
SLIDE 6

By investigating the interference surface you can find the

  • ptimal channels with minimum interference.

[Ekahau, Inc]

slide-7
SLIDE 7

If the Signal-to-Noise Ratio is significantly lower than the signal strength, there’s radio interference affecting your network performance. The grid and survey route visualizations have been turned off.[Ekahau, Inc]

slide-8
SLIDE 8

Visualizing the strongest access points per location. Specific color can be defined for each AP. [Ekahau, Inc]

slide-9
SLIDE 9

The Planner supports quick wall and access point placement, and instantly reacts to changed parameters by displaying the expected coverage, data rate, etc.[Ekahau, Inc]

slide-10
SLIDE 10

Client Software

A Windows CE based or other OS based embedded software package that responds to simple queries for the Application Server.

  • Small XML Request and Responses
  • Reports measured signal strength data of all

access points within range.

slide-11
SLIDE 11

Hardware Components Required

  • A Microsoft .NET enabled Web Server

connected to an IEEE 802.11 network

  • IEEE 802.11 enabled PDA
  • Minimum set of three IEEE 802.11 Access

points

slide-12
SLIDE 12

Interface Issues and Risks

  • Obtaining signal strength data from wireless

access points – Access Point model

  • Obtaining signal strength data from wireless

nodes

  • What is the best way to analyze the signal

strength information for determining position?

  • Signal discrimination and qualification
slide-13
SLIDE 13

Access Point Model

Pros:

  • All 802.11 device positions may be queried and

located without having to install or write different client software for each device

Cons:

  • Not all access points have solutions for

reporting signal strength of available clients

  • Client under test goes into power save mode or

some other low-power broadcasting mode

slide-14
SLIDE 14

Client or Node Software Model

Pros:

  • Built in signal strength capabilities
  • In a large network where there are a large number of

clients this method may prove best

Cons:

  • Requires a client software package that works with

different wireless NIC card drivers and operating systems

  • Location determination is limited to nodes with

installed client software package

slide-15
SLIDE 15

So Which Model?

  • Both if possible

– Numeric signal strength measurements are identical with both models – We know client model will work so I will start here with one client. – Implement Access Point model at home

  • Limit discovery period to 2 weeks

– If previous step is success try to implement on Campus in MEB and/or EMCB

slide-16
SLIDE 16

How to analyze the signal strength information for determining position?

  • Nearest Neighbor
  • Microsoft “RADAR’s” Empirical Model
  • Radio Propagation Model
slide-17
SLIDE 17

Nearest Neighbor

  • The nearest Access point is the location of

the client

– Accurate up to about 6 to 12 meters (size of a room) – Works where less than three Access Points are available – Simple to implement – No client calibration required

slide-18
SLIDE 18

Empirical Model

Uses the nearest neighbor(s) in signal space (NNSS) algorithm. An initial calibration is performed through recording signal strength measurements ss’1, ss’2, and ss’3 into a database for future comparisons. The idea is to compute the distance (in signal space) between the observed set

  • f SS measurements, (ss1,ss2,ss3), and the

recorded SS, (ss’1,ss’2,ss’3), at a fixed set of locations, and then pick the location that minimizes the distance [Bahl and Padmanabhan].

slide-19
SLIDE 19

System Calibration

Step 2

measure signal strength at strategic reference points

Step 1

Define strategic reference points ex: corners of a room

Database Data Management

XML Web Service with Rough Data Interpretation

GUI

Application Interface with Refined Data Interpretation

slide-20
SLIDE 20

Radio Propagation Model

Using a mathematical model of indoor signal propagation, we generate a set of theoretically- computed signal strength data akin to the empirical data set. The data points correspond to locations spaced uniformly on the floor. The NNSS algorithm can then estimate the location of the mobile user by matching the signal strength measured in real-time to the theoretically- computed signal strengths at these locations. It is clear that the performance of this approach is directly impacted by the "goodness” of the propagation model [Bahl and Padmanabhan].

slide-21
SLIDE 21

Signal Discrimination and Qualification

Pictures Speak Volumes about Portability

slide-22
SLIDE 22

Available Research

Research by Kalid Azad, Princeton University undergraduate Student

slide-23
SLIDE 23

My Peak Measurements Hypothesis

slide-24
SLIDE 24

My Peak Measurements Hypothesis Basis

  • Few environmental variables will amplify a

broadcasted RF signal

  • Best signal to determine location is the most

unobstructed or non-attenuated signal

– Proof: Bahl and Padmanabhan with Microsoft during their “RADAR” research found “Max Signal Strength Across Orientations” is more accurate

slide-25
SLIDE 25

Proposed Schedule Flows Week 1 through 2:

  • Develop and write client/server software

tests for acquiring signal strength information from an 802.11 client.

slide-26
SLIDE 26

Week 3 through 4:

  • Attempt to develop and write software tests

for acquiring signal strength information from multiple 802.11 Access points about individual nodes broadcasting their MAC addresses using my home network.

slide-27
SLIDE 27

Week 5 through 6: (If access point model successful)

  • Attempt implementation of access point

model in EMCB and/or MEB.

– This will also require getting special user rights to access the system.

  • If I fail to implement the access point model

then I will move on to the next stage in development.

slide-28
SLIDE 28

Week 7 through 8:

  • Address additional concerns about
  • btaining data from access points and

clients.

  • Collect data through rigorously testing

signal strength measurements in a variety of controlled and uncontrolled environments.

  • Compare and contrast the use of both

models.

slide-29
SLIDE 29

Week 9 through 10:

  • Employ two or three algorithms or techniques for

calculating the location of a client.

  • Evaluate the difficulty, speed, and result quality of

each algorithm when providing each with real- time data.

  • Choose one or two methods that will best

implement the overall objective of locating the room our client is in.

– It might be nice to allow a user to select from more than

  • ne location calculation algorithm. Especially since my

final software package is the product that will demonstrate my research.

slide-30
SLIDE 30

Week 11 through 14:

  • Create a Macromedia Flash form based GUI

for interacting with Web Service

– This will include a point and click graphical mapping interface

  • Build the .NET web service for interacting

with Flash GUI.

– Stores and retrieves location information in and from an SQL Server database.

slide-31
SLIDE 31

Week 15 through 16:

  • Write an alpha software package for the

collection of signal strength measurements and location calculation.

– This includes an easy to use and port client location calibration interface.

slide-32
SLIDE 32

Week 17 through 18:

  • Write a beta software package for the

collection of signal strength measurements and location calculation.

  • Must be configurable using a simple GUI

interface.

  • Include support for simultaneous

multithreaded device location monitoring and user interaction.

slide-33
SLIDE 33

Week 19 through 20:

  • Generate user documentation and help files

for the beta package.

  • Rap up as many loose ends as possible.
slide-34
SLIDE 34

Week 21 through 22:

  • Port the required software routines and

functionality into the .NET Application Server.

  • Dress up the user interface and GUI.
  • Work as many kinks out of the system as

possible.

slide-35
SLIDE 35

Week 23 through 24:

  • Bring complete working system to a candidate

release phase.

  • Test the system, tweak the system, demonstrate

the system, and perform even more system tests.

  • Let someone who is computer illiterate try to use

the system.

– Defined : Computer illiterate – Someone who thinks a CD-ROM drive is a fancy cup holder

  • Tweak and test the system again.
  • Release the candidate.
slide-36
SLIDE 36

Week 25 through 28:

  • Complete my research
  • Finish writing the Thesis.
slide-37
SLIDE 37

Week 29 through 32:

  • Allow more time for things like

– Sickness – Homework – Midterms – Quality Assurance – Emergency vacations to Brazil.

slide-38
SLIDE 38

Work Sited

Kalid Azad. “Indoor positioning using 802.11b wireless networks.” 1 January 2003. February 20, 2003 <http://www.princeton.edu/~kazad/resources/cs/cs398.htm> Paramvir Bahl and Venkata N. Padmanabhan. “RADAR: An In-Building RF-based User Location and Tracking System.” Microsoft Research.

  • 2000. 12 March 2005

<http://research.microsoft.com/~padmanab/papers/infocom2000.pdf> Ekahau, Inc. “Long Term Research In Positioning.” 2004. 12 March 2005 <http://www.ekahau.com>