
SLIDE 1
Incorporate Financial Frictions into a Business Cycle Model Business Cycle Model
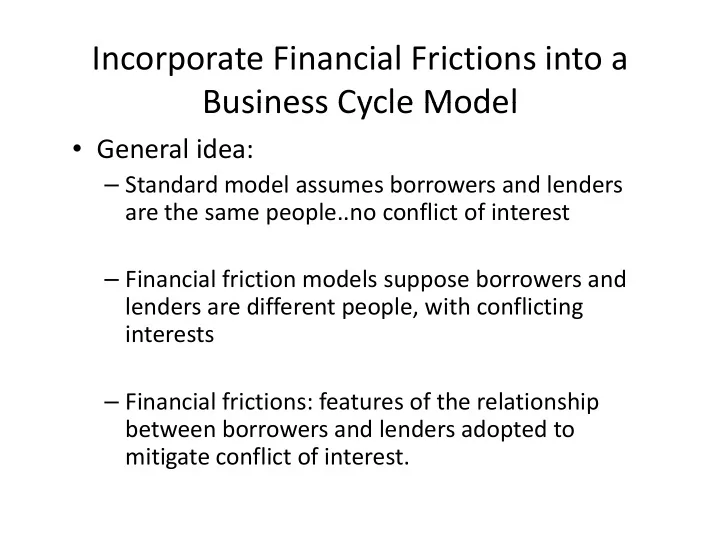
- General idea:
Incorporate Financial Frictions into a Business Cycle Model Business - - PowerPoint PPT Presentation
Incorporate Financial Frictions into a Business Cycle Model Business Cycle Model General idea: Standard model assumes borrowers and lenders are the same people..no conflict of interest Financial friction models suppose borrowers and
consumption Investment goods
Investment goods Supply labor Rent capital
Backyard capital accumulation: Kt1 1 − Kt GIt,It−1 y p
t1
t
t, t 1
uc,t Etuc,t1 rt1
k
1 − Pk′,t1 Pk′,t
Savers and investors are the same: NO FRICTIONS!
Money
Money
Incentive of entrepreneurs to under‐report earnings
h
h wh, − Ul l
l wl
h
l
hK,lh, wl Fl lK,ll h h h l l l
hK,lh, rl Fk l K,ll,
share of gross entrepreneurial earnings in state h kept by entrepreneur
1 − Γh rhK 1 − 1 − ΓlrlK,
share of gross earnings of entrepreneur taken by bank
̄ h
0 dF ̄ h dF
̄ l
̄ l
̄ s,K1 − ΓhrhK 1 − 1 − ΓlrlK
̄ s f d.
c K ≤ Fk,l
household consumption
ch
resources used in monitoring
G ̄ hrhK
entrepreneur consumption
1 − ΓhrhK ≤ FK,lh cl G ̄ lrlK 1 − ΓlrlK ≤ FK,ll
h l
h
h Fl hK,lh, − Ul l
l Fl lK,ll
e 1 − Wt1 e
Firms Labor L K Entrepreneurs Labor market Capital Producers C I Producers household
Firms Labor Entrepreneurs Labor market Capital Producers K’ Producers household banks Loans
revenues from non-bankrupt entrepreneurs quantity of non-bankrupt entrepreneurs receipts from bankrupt entrepreneurs net of bankruptcy costs receipts from bankrupt entrepreneurs net of bankruptcy costs payment obligations on bank debt to households
iid i i t i ti t ̂
iid, univariate innovation to t
0 t−1 1
8
i
i 2 i 2
i
Δlog
Nt1 Pt
t logper capita hourst Δl
per capita creditt
Δlog
p p
t
Pt
Δlogper capita GDPt Δlog
Wt Pt
Δlogper capita It Xt Δlog
per capita M1t Pt
Δlog
per capita M3t Pt
Δlogper capita consumptiont E t l Fi P i , External Finance Premiumt Rt
long − Rt e
Rt
e
ΔlogPI,t Δlogreal oil price
Δlogreal oil pricet Δlog
per capita Bank Reserves t Pt
– important source of fluctuations. – news on the risk shock important
– relatively unimportant as a source of shocks – modest contribution to forecast ability
Actual data versus what actual data would have been if there were only risk Shocks: Note: (1) as suggested by the picture, risk shocks are relatively important at the lower frequencies (2) We find that they are the single most important source of low frequency (2) We find that they are the single most important source of low frequency fluctuation in the EA, and a close second (after permanent tech shocks) in the US
Table: Variance Decomposition, HP filtered data, EA x shock
consumption investment hours inflation labor productivity interest rate f 15.02 23.05 2.63 16.37 35.74 1.40 20.46 x b 0.59 1.29 0.02 0.44 0.52 1.44 0.24 0.32 0.01 0.12 0.18 0.08 0.01 0.04
Markup Banking tech Capital tech
0.32 0.01 0.12 0.18 0.08 0.01 0.04 0.02 0.06 0.00 0.02 0.00 0.00 0.00 g 3.26 3.11 0.00 3.34 0.87 0.21 0.48 z
∗
3.72 1.16 0.24 1.42 1.07 10.29 0.72 0 43 0 06 0 92 0 80 0 24 1 52 0 30
Capital tech Money demand Government Permanent tech Gamma shock
0.43 0.06 0.92 0.80 0.24 1.52 0.30 10.54 21.68 0.49 7.46 16.10 27.52 8.56 policy 6.22 11.27 1.01 4.14 5.40 0.10 33.15 2.88 0.19 5.11 6.57 0.88 13.17 1.08 20 09 1 81 38 09 15 96 9 22 38 24 9 80
Gamma shock Temporary tech Monetary policy Risk, contemp Si l i k
signal 20.09 1.81 38.09 15.96 9.22 38.24 9.80 and signal 22.96 2.00 43.20 22.53 10.09 51.41 10.88 c 11.68 32.75 0.15 12.20 11.26 0.83 10.15 i 24.57 1.72 51.14 30.69 10.17 5.22 11.56
Signals on risk Risk and signals Discount rate Marginal eff of I f l
oil 0.42 1.39 0.03 0.24 2.21 0.04 1.32 long 0.00 0.00 0.00 0.00 0.00 0.00 0.00 measurement error 0.00 0.00 0.00 0.00 0.00 0.00 1.26 inflation target 0.24 0.43 0.05 0.16 6.23 0.01 0.87
Price of oil Long rate error
all shocks 100.00 100.00 100.00 100.00 100.00 100.00 100.00
Table: Variance Decomposition, HP filtered data, EA x shock
consumption investment hours inflation labor productivity interest rate f 15.02 23.05 2.63 16.37 35.74 1.40 20.46 x b 0.59 1.29 0.02 0.44 0.52 1.44 0.24 0.32 0.01 0.12 0.18 0.08 0.01 0.04 0.32 0.01 0.12 0.18 0.08 0.01 0.04 0.02 0.06 0.00 0.02 0.00 0.00 0.00 g 3.26 3.11 0.00 3.34 0.87 0.21 0.48 z
∗
3.72 1.16 0.24 1.42 1.07 10.29 0.72 0 43 0 06 0 92 0 80 0 24 1 52 0 30 0.43 0.06 0.92 0.80 0.24 1.52 0.30 10.54 21.68 0.49 7.46 16.10 27.52 8.56 policy 6.22 11.27 1.01 4.14 5.40 0.10 33.15 2.88 0.19 5.11 6.57 0.88 13.17 1.08 20 09 1 81 38 09 15 96 9 22 38 24 9 80
It’s the
signal 20.09 1.81 38.09 15.96 9.22 38.24 9.80 and signal 22.96 2.00 43.20 22.53 10.09 51.41 10.88 c 11.68 32.75 0.15 12.20 11.26 0.83 10.15 i 24.57 1.72 51.14 30.69 10.17 5.22 11.56
It s the signals!
oil 0.42 1.39 0.03 0.24 2.21 0.04 1.32 long 0.00 0.00 0.00 0.00 0.00 0.00 0.00 measurement error 0.00 0.00 0.00 0.00 0.00 0.00 1.26 inflation target 0.24 0.43 0.05 0.16 6.23 0.01 0.87 all shocks 100.00 100.00 100.00 100.00 100.00 100.00 100.00
Table: Variance Decomposition, HP filtered data, EA x shock stock market credit spread term structure real M1 real M3 shock stock market credit spread term structure real M1 real M3 f 1.83 13.15 0.16 12.36 44.28 1.82 x b 0.00 0.14 0.00 0.10 5.04 42.39 0.18 0.07 0.03 0.07 0.03 0.02
Markup Banking tech Capital tech
0.00 0.00 0.00 0.00 13.17 22.63 g 0.03 0.10 0.01 0.07 0.44 0.02 z
∗
0.17 0.07 0.05 0.14 0.42 1.29 5 37 25 82 1 86 0 33 0 13 0 15
Money demand Government Permanent tech Gamma shock
5.37 25.82 1.86 0.33 0.13 0.15 0.10 4.06 0.00 3.40 9.89 0.61 policy 4.89 1.81 0.99 25.76 13.15 1.58 13.94 5.07 20.58 0.97 1.39 0.76
Gamma shock Temporary tech Monetary policy Risk, contemp
signal 68.29 44.23 75.90 6.79 5.98 6.20 and signal 82.22 49.30 96.48 7.76 7.38 6.96 c 0.02 1.72 0.02 3.99 2.46 15.40 1 90 2 54 0 27 8 77 1 18 6 17
Signals on risk Risk and signals Discount rate Marginal eff of I
i 1.90 2.54 0.27 8.77 1.18 6.17 oil 0.14 0.94 0.05 0.56 1.87 0.15 long 0.00 0.00 0.00 36.05 0.00 0.00 measurement error 2.89 0.19 0.02 0.32 0.21 0.02
Marginal eff of I Price of oil Error in long rate
inflation target 0.24 0.10 0.05 0.34 0.35 0.80 all shocks 100.00 100.00 100.00 100.00 100.00 100.00
Table: Variance Decomposition, HP filtered data, EA x shock stock market credit spread term structure real M1 real M3 shock stock market credit spread term structure real M1 real M3 f 1.83 13.15 0.16 12.36 44.28 1.82 x b 0.00 0.14 0.00 0.10 5.04 42.39 0.18 0.07 0.03 0.07 0.03 0.02
Markup Banking tech Capital tech
0.00 0.00 0.00 0.00 13.17 22.63 g 0.03 0.10 0.01 0.07 0.44 0.02 z
∗
0.17 0.07 0.05 0.14 0.42 1.29 5 37 25 82 1 86 0 33 0 13 0 15
Money demand Government Permanent tech Gamma shock
5.37 25.82 1.86 0.33 0.13 0.15 0.10 4.06 0.00 3.40 9.89 0.61 policy 4.89 1.81 0.99 25.76 13.15 1.58 13.94 5.07 20.58 0.97 1.39 0.76
Gamma shock Temporary tech Monetary policy Risk, contemp
signal 68.29 44.23 75.90 6.79 5.98 6.20 and signal 82.22 49.30 96.48 7.76 7.38 6.96 c 0.02 1.72 0.02 3.99 2.46 15.40 1 90 2 54 0 27 8 77 1 18 6 17
Signals on risk Risk and signals Discount rate Marginal eff of I
i 1.90 2.54 0.27 8.77 1.18 6.17 oil 0.14 0.94 0.05 0.56 1.87 0.15 long 0.00 0.00 0.00 36.05 0.00 0.00 measurement error 2.89 0.19 0.02 0.32 0.21 0.02
Marginal eff of I Price of oil Error in long rate Signal matters!
inflation target 0.24 0.10 0.05 0.34 0.35 0.80 all shocks 100.00 100.00 100.00 100.00 100.00 100.00
News Specification on Risk and Marginal Likelihood (EA data)
1 2 p
̂ t 1 ̂ t−1 t−0 t−1
1
t−2
2
...t−p
p
p log, marginal likelihood odds (exp(difference in log likelihood from baseline)) 8 (baseline) 4397.487 1 ( ) 6 4394.025 31 1 4325.584
Baseline model with no Fisher Effect Baseline model Blue line: baseline model with no financial frictions
e yt − Risky ratet − Risk free ratet
Get a recession, just like in earlier graph g p
Taylor suggestion creates a boom Is it too much? Is it too much?
Taylor’s suggestion overstimulates Taylor’s suggestion overstimulates