
SLIDE 1
Annual al General ral Meeting ing of Shar areholders
- lders
TSX TSX: EDR I NYSE: E: EXK I www.ed .edrs rsilver ilver.com .com
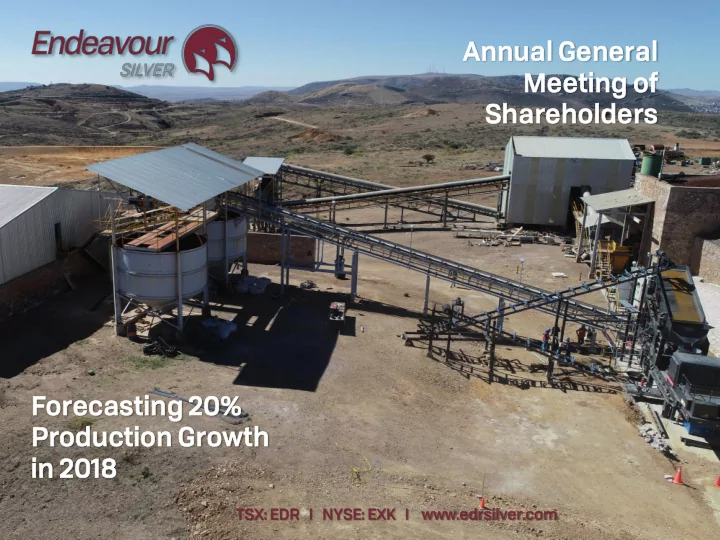
in n 2018 TSX: EDR I TSX NYSE: E: EXK I www.ed .edrs - - PowerPoint PPT Presentation
Annual al General ral Meeting ing of Shar areholders olders Fore reca casti sting ng 20% % Pro roduct ctio ion n Gro rowth th in n 2018 TSX: EDR I TSX NYSE: E: EXK I www.ed .edrs rsilver ilver.com .com Cautio
TSX TSX: EDR I NYSE: E: EXK I www.ed .edrs rsilver ilver.com .com
GROWTH WITH INTEGRITY 2
This presentation contains “forward-looking statements” within the meaning of the United States private securities litigation reform act of 1995 and “forward-looking information” within the meaning of applicable Canadian securities legislation. Such forward-looking statements and information herein include, but are not limited to, statements regarding Endeavour’s anticipated performance in 2018 and future years, including revenue, cash flow, operating and capital cost forecasts, silver and gold production, timing and expenditures to explore and develop new silver mines and mineralized zones, silver and gold grades and recoveries, cash and all-in sustaining costs per ounce, initial and sustaining capital expenditures, and the use of the Company’s working capital. The Company does not intend to, and does not assume any obligation to update such forward-looking statements or information, other than as required by applicable law. Forward-looking statements or information involve known and unknown risks, uncertainties and other factors that may cause the actual results, level
Mexican peso, Canadian dollar and U.S. dollar); fluctuations in the price of consumed commodities, changes in national and local governments, legislation, taxation, controls, regulations and political or economic developments in Canada and Mexico; operating or technical difficulties in mineral exploration, development and mining activities; risks and hazards of mineral exploration, development and mining (including environmental hazards, industrial accidents, unusual or unexpected geological conditions, pressures, cave-ins and flooding); inadequate insurance, or inability to obtain insurance; availability of and costs associated with mining inputs and labour; the speculative nature of mineral exploration and development, reliability
mined; risks in obtaining necessary licenses and permits, global market events and conditions and challenges to the Company’s title to properties; as well as those factors described in the section “risk factors” contained in the Company’s most recent form 40F/Annual Information Form filed with the S.E.C. and Canadian securities regulatory authorities Forward-looking statements are based on assumptions management believes to be reasonable, including but not limited to: the continued operation
products will be completed in accordance with management’s expectations and achieve their stated production outcomes, and such other assumptions and factors as set out herein. Although the Company has attempted to identify important factors that could cause actual results to differ materially from those contained in forward- looking statements or information, there may be other factors that cause results to be materially different from those anticipated, described, estimated, assessed or intended. There can be no assurance that any forward-looking statements or information will prove to be accurate as actual results and future events could differ materially from those anticipated in such statements or information. Accordingly, readers should not place undue reliance on forward-looking statements or information.
GROWTH WITH INTEGRITY 3
Guiding 20% production growth in 2018 to 5.8-6.4 mil
Four high-grade silver-gold mines located in three historic mining districts of Mexico Building new mines to fuel future growth; best
Terronera silver-gold discovery still growing; PFS shows robust economics
1. Silver equivalents based on a 75:1 gold: silver ratio
El Compas acquired in 2016, started development in 2017, production in 2018 Renewed focus on reducing operating costs; new focus on near-term growth
GROWTH WITH INTEGRITY 4 Product duction ion Developmen
Explora ration ion Offi fice Mexic ico Off ffic ice Leon Canada ada
Head Office Vancouver
Mexic ico City
Sierra Madre Occidental Silver & Gold Belt
Terroner era El Cubo
Guanajuato Zacatecas
Lourde des Bolañit itos
Guanac acev eví Parral
Chihuahua
Guada dalupe pe y y Calvo
Durango Jalisco
Mines Exploration Development Guadalupe y Calvo Parral Lourdes Guanaceví Bolañitos El Cubo Terronera El Compas El Comp mpas as Chil ile Off ffic ice e Santiag iago Cerro Marquez
5 GROWTH WITH INTEGRITY
5 10 15 2004 2005 2006 2007 2008 2009 2010 2011 2012 2013 2014 2015 2016 2017 2018 est. Silver & Equivalent ounces (millions)
2013 Acquired Terronera Gold Silver Silver equivalent
2007 acquired Bolañitos 2004 acquired Guanaceví 2012 acquired El Cubo Ten years of production growth during bull market 2016 Acquired El Compas & Parral Foreca ecast sting ing +20% increase rease in 2018 product duction ion
(1)
Mid-poin int of guidance
Strategic acquisitions during bear market will fuel growth
6
$92.17 $96.81 $95.05 05 $80.18 $72.42 $82.36 36 $82.50
10 20 30 40 50 60 70 80 90 100 110 120
2012 2013 2014 2015 2016 2017 2018 est.
Consolidated Direct Costs (US$/Tonne)
$7.87 $8.31 $8.39 $6.78 $8.06 $6.50
5 10
2013 2014 2015 2016 2017 2018 est.
Consolidated Cash Costs, net of gold by- product credits (US$/oz Sold)
$18.31 31 $16.79 $15.62 62 $12.43 $16.96 $15.50
10 20 30
2013 2014 2015 2016 2017 2018 est.
Consolidated AISC, net of gold by-product credits (US$/oz Sold)
Mid-point of guidance (2) Mid-point of guidance(2)
GROWTH WITH INTEGRITY
Mid-point of guidance(2)
7 GROWTH WITH INTEGRITY
Q1, 2018 8 Producti uction n Up 20% Y-o-Y Y to 1.35 million oz Ag, 13,208 oz Au for 2.3 million oz Ag Eq(1) , production to rise each quarter during 2018 Strong ng Q1, 2018 8 Financ ancia ial l Performan mance e Y-o-Y Y Revenue, cash flow and EBITDA all up, however net earnings down due to higher depreciation 201 017 Produc uction Met Revised Guidan ance –4.9 million oz Ag and 53,007 oz Au for 8.9 million oz Ag Eq(1) notwithstanding operating issues at Guanacevi Reserve erves Increas ased ed 228% 8% – to 57.1 million oz Ag Eq, primarily due to resource conversion at Terronera Commi mission El Compas as –mine development nearly complete, expanded mill capacity and mine plan by 30%, on track for commercial production in Q3/18 Terrone nera a Positi tive e PFS S – optimization underway, received mine and plant permits, awaiting dumps and tailings permits Parral Maiden n Resour urce e – 32.3 million oz Ag Eq with exploration upside
2.4 mil oz 3.0 mil oz 3.5 mil oz
2017 7 Revenue e of $150.5 0.5 millio ion
44% Au
51,460
56% % Ag
4.9 million
2017 Ag Eq Eq Product
ion of 8.9 millio ion oz
El Cubo, 40% Bolanitos, 33% Guanacevi, 27%
8
Fallin ling g Operati ting g Costs – due to rising production, Cash costs(1,2) decreased 17% & AISC(1,3) decreased 22%.
$7.81 $6.50
Q1/1 1/17 Q1/1 1/18
$18.24 $14.18
Q1/1 1/17 Q1/1 1/18
Cash Cost t (US$/oz
AISC (US$/ $/oz
d)
Cash costs fell due to improved grades AISC fell due to lowered cash costs & lower capital expenditures
information on “Non-GAAP” measures found on the company website
exploration, share-based compensation, reclamation, and sustaining capital net of gold credits
GROWTH WITH INTEGRITY
2.0M M oz
2.1M oz
2.3M M oz
2.3M oz
Q1/1 1/17 Q2/17 /17 Q3/17 3/17 Q4/17 /17 Q1/1 1/18
Guanacevi Bolanitos El Cubo
2.5M oz
Producti uction n Imp mproveme ement nts Under erway ay (4) – Q1/18 production below plan due to decreased throughput.
2%
Q4/18 /18 ( (est.)
Production expected to rise Q-o-Q in 2018
GROWTH WITH INTEGRITY 9
10
and only mine that produces dore bars
sides of this 5th largest silver mining district in Mexico
Cruz vein since 2004
currently operating at 8-900 tpd
developed to production starting in late 2018
line with revised guidance, despite operational challenges and lower throughput
underway to boost production & reduce costs by Q3, 2018
1. Silver equivalents based on a 75:1 gold: silver ratio
GROWTH WITH INTEGRITY
GROWTH WITH INTEGRITY 11
2017 7 Reserv erves es and d Resou
rces (1) Proven and probable 2.4 million oz Ag 5,500 oz Au Measured and indicated 19 million oz Ag 45,700 oz Au Inferred 9.8 million oz Ag 21,600 oz Au Financ ancials ials Q1 2018 Cash costs (2,3) $15.31/oz All-in sustaining costs (2,4) $22.62/oz
1. At December 31, 2017. Refer to tables in the Appendix for full details. 2. Cash costs per ounce and AISC per ounce are examples of Non-IFRS measures. See disclosure in quarterly MD&A for information on “Non-GAAP” measures found on the company website 3. Net of by-product credits 4. All-in sustaining costs (AISC) include mining, processing, direct overhead, corporate G&A, on-site exploration, share-based compensation, reclamation, and sustaining capital net of gold credits
549,6 ,666 66 oz
614,7 ,707 oz
637,492 492 oz
604,8 ,854 54 oz
833 tpd 811 tpd 912 tpd 877 tpd
600 650 700 750 800 850 900 950
400,000 450,000 500,000 550,000 600,000 650,000
Q2/17 /17 Q3/17 3/17 Q4/17 /17 Q1/1 1/18
Produc uctiv tivity ity Program ram Underw erway ay
Ag Eq Eq (4) Producti duction (oz
) Throughput t (tpd) )
12
GROWTH WITH INTEGRITY
13
Guanajuato, the 2nd largest silver district in Mexico
significantly exceeded 2017 guidance due to higher Ag & Au grades
Asuncion areas since 2007
+ 1,200 tpd
thick widths and high gold grades
is essentially free
underway to improve recoveries by 4-5%
1. Silver equivalents based on a 75:1 gold: silver ratio
GROWTH WITH INTEGRITY
GROWTH WITH INTEGRITY 14
2017 7 Reserv erves es and d Resou
rces (1) Proven and probable 1.15 million oz Ag 27,800 oz Au Measured and indicated 3.8 million oz Ag 47,400 oz Au Inferred 4.6 million oz Ag 59,200 oz Au Financ ancials ials Q1 2018 Cash costs (2,3) $(-2.77)/oz All-in sustaining costs (2,4) $4.20/oz
1. At December 31, 2017. Refer to tables in the Appendix for full details. 2. Cash costs per ounce and AISC per ounce are examples of Non-IFRS measures. See disclosure in quarterly MD&A for information on “Non-GAAP” measures found on the company website 3. Net of by-product credits 4. All-in sustaining costs (AISC) include mining, processing, direct overhead, corporate G&A, on-site exploration, share-based compensation, reclamation, and sustaining capital net of gold credits
753,391 91 oz
743,012 oz
821,0 ,012 oz
698,466 ,466 oz
1,265 tpd 1,265 65 tpd 1,350 tpd 1,278 tpd
600 700 800 900 1,000 1,100 1,200 1,300 1,400 400,000 450,000 500,000 550,000 600,000 650,000 700,000 750,000 800,000 850,000
Q2/17 /17 Q3/17 3/17 Q4/17 /17 Q1/1 1/18
Operat ration
al Improvem emen ents ts Underw erway ay
Ag Eq Eq (4) Producti duction (oz
) Throughput t (tpd) )
15
GROWTH WITH INTEGRITY
16
Guanajuato, the 2nd largest silver mining district in Mexico
area since 2012
was below guidance due to lower than planned Au production
turnaround and is now a core asset
2012 when we bought the mine and $13 per oz in 2016 after the turnaround
currently operating at 1,300-1,500 tpd
underway to improve recoveries by 2-3%
1. Silver equivalents based on a 75:1 gold: silver ratio
GROWTH WITH INTEGRITY
GROWTH WITH INTEGRITY 17
2017 7 Reserv erves es and d Resou
rces (1) Proven and probable 2.9 million oz Ag 27,000 oz Au Measured and indicated 3.4 million oz Ag 45,000 oz Au Inferred 5.1 million oz Ag 73,200 oz Au Financ ancials ials Q1 2018 Cash costs (2,3) $2.93/oz All-in sustaining costs (2,4) $11.22/oz
1. As at December 31, 2017. Refer to tables in the Appendix for full details. 2. Cash costs per ounce and AISC per ounce are examples of Non-IFRS measures. See disclosure in quarterly MD&A for information on “Non-GAAP” measures found on the company website 3. Net of by-product credits 4. All-in sustaining costs (AISC) include mining, processing, direct overhead, corporate G&A, on-site exploration, share-based compensation, reclamation, and sustaining capital net of gold credits
820,0 ,081 oz
927,945 945 oz
1,071,7 1,733 oz
1,038,120 ,120 oz
1,279 tpd 1,279 tpd 1,542 42 tpd 1,463 63 tpd
800 900 1,000 1,100 1,200 1,300 1,400 1,500 1,600 400,000 500,000 600,000 700,000 800,000 900,000 1,000,000 1,100,000 1,200,000
Q2/1 /17 Q3/1 3/17 Q4/1 /17 Q1/ 1/18
Operat ration
al Improvem emen ents ts Underw erway ay
Throughput t (tpd pd) ) Ag Eq Eq (4) Producti duction (oz
)
18
GROWTH WITH INTEGRITY
19
La Plomosa Panuco Vetagrande San Juan Mala Noche Calicanto La Cantera La Parroquia Compas Orito Plant
targeting 2018 production of 100,000 oz silver, 7-8,000 oz gold, 6-800,000 million oz AgEq (1)
Zacatecas, the 3rd largest silver mining district in Mexico
already drilled, in reserves and resources
government plant is leased for 10 years
capacity ultimately 500 tpd so mine is scalable depending on new reserves
silver oz, IRR more than 42%
newly acquired old mines have never been drilled, represent discovery opportunities
1. Silver equivalents based on a 75:1 gold: silver ratio
GROWTH WITH INTEGRITY
20
Prelim limina nary y Econo nomic mic Assessmen ment – robust economic returns, very scalable if we discover or purchase additional mineral resources in the Zacatecas district and refurbish the second ball mill to double the plant capacity to 500 tpd Low capex ex – $11.3 million Low opex – $110 per tonne including $69.80 mining, $26.20 processing, $14.00 G&A Total al cash h costs (1
(1) – $9.09 per Ag Eq oz (2) or lower
All-in in sustai aini ning ng costs ts (1,3) – $9.64 per Ag Eq oz or lower Improved ed Operati ating ng Metr trics ics
Resour urces (4)
Clas assifi ificat atio ion Tonne nes (000s) Ag Ag g/t g/t Au g/t g/t Ag Eq g/t Ag oz (000s) Au oz (000s) Ag Eq oz (000s) Indi dicat ated 148.4 104 7.31 652 495 34.9 3.112.5 Inferre red 217 76 5.38 480 530 37.5 3,342.5
Econo nomics mics
Ag Price Au Price IRR NPV Paybac back Perio iod US$16/oz 6/oz US$1,120/oz 29% US$8.0m 2.6 years US$18/oz /oz Base Case US$1,260/oz 42% US$12.6m 2.1 years US$20/o /oz US$1,400/oz 54% US$17.0m 1.8 years
1. Net of by-product credits 2. Silver equivalents based on 75:1 silver:gold ratio 3. All-in sustaining costs (AISC) include mining, processing, direct
compensation, reclamation, and sustaining capital net of gold credits 4. As at Feb 7, 2018 – for full details refer to the table in the appendix
GROWTH WITH INTEGRITY
21
GROWTH WITH INTEGRITY
are complete or nearly complete Obtained explosives permit in March; ramp advance has crossed the San Juan vein Mobile crushing unit and conveyors are on site and being installed for testing Mine power line, portal infrastructure & tailings dam complete, mine access road 95% complete
22
GROWTH WITH INTEGRITY
23
Terroner ronera Discov covery ery
production est. 3.1 million oz silver, 26,000 oz gold for 5.0 million oz AgEq
Sebastian, 50 old mines on 20 known veins, all closed in 1910 Mexican revolution
million oz Ag Eq(1) in reserves and resources , still open for expansion, many other veins to drill
dumps and tailings permits
18 months, initial production to commence end of 2019, double production in 2020-2021
capacity ultimately up to 1,500 tpd so mine is scalable depending on new reserves
high grade La Luz discovery not yet in resources, multiple discovery opportunities
GROWTH WITH INTEGRITY
La Luz Discov covery ery
24
Gold ounces converted to silver equivalent ounces on a 70:1 ratio
Open Open
Hole Struc uctur ure
From True width Au Ag AgEq
(m) (m) (gpt) (gpt) (gpt) TR09-6* 6* Terronera 505.10 6.7 5.0 226 576 Including 511.40 0.7 16.9 527 1,710 TR10 10.5-1* 1* Terronera 380.75 6.6 2.9 717 923 Including 386.90 0.4 3.0 4,860 5,069 TR14 14-7* 7* Terronera 363.90 4.8 3.9 109 383 Including 372.25 0.5 11.1 246 1,020 TR11 11-3 Terronera 498.55 16.3 1.8 230 359 Including 515.25 0.3 8.9 3,490 4,110 KP16 16-04 04 Terronera 263.15 7.5 0.7 307 356 Including 271.20 0.6 1.4 1,160 1,259 Hole Struc uctur ure From True ue width Au Au Ag Ag AgEq (m) (m) (gpt) (gpt) (gpt) LL LL-02* La Luz 207.45 1.1 58.6 408 4,512 Including 208.61 0.3 238.0 1365 18,025 LL LL-13 13 La Luz 131.75 1.5 19.0 407 1,735 Including 132.95 0.4 48.9 680 4,103 LL LL-14 14 La Luz 175.30 1.5 29.5 651 2,719 Including 176.25 0.6 62.9 844 5,247 LL LL-17 17 La Luz 124.55 1.4 23.1 245 1,865 Including 124.55 0.5 47.5 212 3,537 LL LL-21 21 La Luz 173.10 2.2 57.0 63 4,054 Including 173.60 0.3 320.0 340 22,740
Open
GROWTH WITH INTEGRITY
Infill Drill Program Step-out Drill Program
25
Pre-fea feasibility ibility study – robust economic returns; 750 tpd, expanding to 1,500 tpd in year two, under review Produ
ction
cision
the new Terronera mine subject to receiving final permits and debt financing Permits its pend ndin ing – MIA (EIS) already approved, mine and plant received Q3, 2017 awaiting tailings and dumps Q2, 2018 Optimi timized zed PFS underw erway ay– Scheduled for release in Q2-2018 Projec ected ted Low Total tal Cash h Costs ts & AISC (4)
$3.44 / Ag oz $4.76 / Ag oz Cash Costs(1,3) AISC (2,3)
quarterly MD&A for information on “Non-GAAP” measures found on the company website
GROWTH WITH INTEGRITY
26
GROWTH WITH INTEGRITY
27
Colorada mine produced 4 million oz silver per year before closing in 1990
silver mining district in Mexico
Palmilla and San Patricio veins
Mexico in 1800”s, provided silver to the Mexican mint, open pit potential
polymetallic resource at El Cometa property
economic study in 2018
discovery opportunities
GROWTH WITH INTEGRITY
28
already in place
Colorado historic resource in 2017
Patricio and La Palmilla over next two years
based on extensive sample database
mineralization
quartz-Kspar-calcite veins
mines to the South, Levon’s Cordero project to the NE, Kootenay’s Cigarra project to the West
GROWTH WITH INTEGRITY
29 Issued/Outstanding (March 31, 2018) 127.5 million Exchange Listings NYSE:EXK, TSX:EDR Fully Diluted (March 31, 2018) 133.7 million Working Capital (March 31, 2018) US$66.6 million Recent Price (April 30, 2018) US$3.00 Cash Position (March 31, 2018) US$36.6 million Market Cap (April 30, 2018) US$383 million Major Shareholder Van Eck 8% 52-week High/Low (April 30, 2018) US$3.39/$1.94 Strategic Shareholder Fresnillo 2% 90-day avg Daily Volume (April 30, 2018) +2.0 million Mining Analysts 9 GROWTH WITH INTEGRITY
0.0% 10.0% 20.0% 30.0%
Silvercorp Metals Inc. (TSX:SVM) Endeavour Silver Corp. (TSX:EDR) First Majestic Silver Corp. (TSX:FR) Great Panther Silver Limited (TSX:GPR) Fortuna Silver Mines Inc. (TSX:FVI) SSR Mining Inc. (TSX:SSRM)
30
ete e Guanaceví aceví prod roducti ctivity ity optimi timization zation – get mine back on plan with rising production, falling costs
ate Terr rron
era PFS - receive final Terronera permits, make production decision, raise debt financing & commence mine development
ission
as mine e – commercial production in July 2018
ll Parral al targets gets – grow resources, explore multiple new veins, consolidate land holdings in district, complete PEA
and proj
ect pipelin eline e – accretive mergers and acquisitions
end mine e lives es – aggressive brownfields exploration
GROWTH WITH INTEGRITY
31
MID-TIER PRECIOUS METALS PRODUCER
Three high-grade silver-gold mines in Mexico
STRONG ORGANIC GROWTH PROFILE
Building new mines to increase production and reduce costs
EXPERIENCED MANAGEMENT TEAM
Proven track record with exploration, development and
STRONG BALANCE SHEET
$66.6 million working capital, no debt
(as at 3/31/2018)
PURE SILVER/ GOLD LEVERAGE
No base metals, no hedging & industry leading beta to silver price (60/40 silver gold producer)
Our mission is to create value for our shareholders and become a premier silver producer in the silver mining industry.
GROWTH WITH INTEGRITY 32
GROWTH WITH INTEGRITY 33
GROWTH WITH INTEGRITY 34
gold, silver is consumed and the number of industrial uses is multiplying
and heat, used in electronics, batteries, solar panels, alloys & coatings, LED & RFID chips, semi- conductors, photography, anti- bacterials, preservatives, medicines
silver is money and its role as a store of value and a hedge against monetary inflation is growing
governments throughout history have “printed” money; eg. falling silver % in the Roman Denarius coin
Denarius % Silver
35
Source: GFMS, Thomson Reuters
GROWTH WITH INTEGRITY 36
Source: GFMS, Thomson Reuters
37
Source: GFMS, Thomson Reuters
average price $18.80 in 2018
next boom will be dependent on the economic backdrop
performer of industrial offtake. Electronics will also be a positive driver.
2016 was the beginning of this protracted decline. Meanwhile, scrap will stabilize if not increase marginally on rising IP
held in custodian vaults. In the case of lack in significant demand increase, this could dampen sustainable price rises in the next years
GROWTH WITH INTEGRITY 38
GROWTH WITH INTEGRITY 39
scarcity of primary silver mining companies
mid-tier silver producers
0.0% 10.0% 20.0% 30.0%
Endeavour Silver Corp. (TSX:EDR) Coeur Mining, Inc. (NYSE:CDE) Pan American Silver Corp. (TSX:PAAS) Hecla Mining Company (NYSE:HL) Tahoe Resources Inc. (TSX:THO) Wheaton Precious Metals Corp. (TSX:WPM)
40
Much stronge nger r lever erage age to silver er price ce than gold miners to gold price
Sources: Bloomberg, as at Jan 10, 2018
During bull markets, silver equities typically rise up to double the gold equities One-year ear beta Three ee-year year beta Five-year ear beta End ndeavour eavour 1.10 1.72 1.71 First Majestic 1.41 1.57 1.55 Fortuna 1.18 1.51 1.60 Wheaton PM 0.69 1.18 1.19 Coeur 1.00 1.47 1.36 Hecla 0.97 1.36 1.19 Fresnillo 1.04 1.18 1.14 Hochschild 1.57 1.86 1.49 Pan American 1.14 1.31 1.16
GROWTH WITH INTEGRITY 41
GROWTH WITH INTEGRITY 42
Management
Bradford Cooke, M.Sc., P.Geo. – Founder and CEO Godfrey Walton, M.Sc., P.Geo. – President and COO Dan Dickson, CA – CFO Dale Mah, B.Sc., P.Geo. – VP, Corporate Development Luis Castro, Ing. Geo. – VP, Exploration Christine West – VP, Controller Miguel Ordaz, Ing. Geo. – Mexico Projects Director and Legal Representative Galina Meleger, CIM – Director, Investor Relations Lorena Aguilar, CHRP – Director, Human Resources
Board of Directors
Bradford Cooke, M.Sc., P.Geo. – Company CEO Godfrey Walton, M.Sc., P.Geo. – Company President and COO Geoff Handley, B.Sc. – Independent Director, Chair (1)(2)(3) Rex McLennan, B.Sc., MBA, ICD.D – Independent Director (1)(3)(4) Ricardo Campoy, B.Sc. – Independent Director (1)(2) Ken Pickering, P.Eng. – Independent Director(1)(2)(4) Mario Szotlender, B.IR – Independent Director(2)(3)(4)
(1) Audit Committee (2) Compensation Committee (3) Corporate Governance and Nominating Committee (4) Sustainability Committee
GROWTH WITH INTEGRITY 43
Markets
44
$ millions unless otherwi wise stated, US dollar ars
Guanac acev evi i Bolan anit itos El Cubo El Compas as (1) Consol
idated ed
Silve ver Producti duction (M oz
) 2.2 – 2.5 1.0 – 1.1 2.5 – 2.7 0.1 - 0.1 5.8 – 6.4 Gold ld Producti duction (K oz
) 5.0 – 5.5 23.5 – 25.5 22.5 – 24.5 7.0 – 8.5 58.0 .0 – 64.0 .0 Silve ver Eq Eq Producti duction (M oz
) (2) 2.6 – 2.9 2.8 – 3.0 4.2 – 4.5 0.6 – 0.8 10.2 .2 – 11.2 Cash sh Cost sts, s, net t of gold d by-pr product ct credit dits s (US$/oz
) (3),
, (4)
$6.00 .00 - $7.00 .00 AISC, SC, net t of gold d by-pr product duct credits dits (US$/ oz
) (3),
, (4)
$15.00 .00 - $16.00 6.00 Sustain tainin ing Capital pital $41.1 .1 Growth Capit pital l $7.3 $7.3 Explo plorat atio ion Budget $11.1 .1
1. El Compas is scheduled to achieve commercial production by the end of July 2018. 2. Gold ounces converted to silver equivalent ounces on a 75:1 ratio in 2018 3. Cash costs per ounce and AISC per ounce are examples of Non-IFRS measures. See disclosure in quarterly MD&A for information on “Non-GAAP” measures found on the company website. 4. See EDR News Release dated January 25, 2018 for full disclosure on 2018 Guidance; 2018 costs forecasts reflect an 19:1 Mexican Peso per US Dollar exchange rate, $17/ oz Ag & $1,275/ oz Au price assumption.
Guidan ance Highlig lights
two new orebodies at Guanacevi
towards development Guana nacevi cevi Bolanit lanitos
El Cubo
pas
GROWTH WITH INTEGRITY
2018 Ag Eq Eq Produc ductio ion n by Mine ne (M oz
)
26% 27% 41% 6% 6%
GROWTH WITH INTEGRITY 45
Silver-Gold Reserves and Resources
Tonnes (000s) Ag g/t Au g/t Ag Eq g/t Ag oz (000s) Au oz (000s) Ag Eq oz (000s) Proven Guanaceví 82 224 0.49 261 591 1.3 688.5 Bolañitos 154 87 2.48 273 431 12.3 1,353.5 El Cubo 171 184 1.80 319 1,010 9.9 1,752.5 Total Proven 407 155 1.80 290 2,032 23.5 3,794.5 Probable Guanaceví 224 252 0.58 296 1,812 4.2 2,127 Bolañitos 258 86 1.87 226 714 15.5 1,876.5 El Cubo 317 186 1.68 312 1,894 17.1 3,176.5 Terronera 4,061 207 1.95 353 27,027 255 46,152 Total Probable 4,860 201 1.87 341 31,447 291.8 53,332 Total P+P 5,267 198 1.86 337 33,479.4 315.3 57,126.5 Measured Guanaceví 17 299 0.38 328 167 0.2 182 Bolañitos 31 118 2.28 289 118 2.3 290.5 El Cubo 207 184 2.90 402 1,225 19.3 2,672.5 Total Measured 255 184 2.66 384 1,510 21.8 3,145 Indicated Guanaceví 1,650 310 0.80 370 16,449 42.4 19,629 Bolañitos 763 152 1.84 290 3,727 45.1 7,109.5 El Cubo 404 165 1.98 314 2,143 25.7 4,070.5 El Compas 148 104 7.31 652 495 34.9 3,112.5 Guadalupe y Calvo 1,861 119 2.38 298 7,120 142.4 17,800 Parral (new) 37 184 0.27 204 216 0.3 238.5 Total Indicated 4,863 193 1.86 332 30,150 290.8 51,960 Total M&I 5,118 192 1.90 335 31,660 312.6 55,105 Inferred Guanaceví 761 314 0.78 373 7,684 19.1 9,116.5 Bolañitos 945 150 1.95 296 4,556 59.2 8,996 El Cubo 1,100 143 2.07 298 5,058 73.2 10,548 Terronera 1,174 288 2.16 375 10,848 43.7 14,125.5 El Compas 217 76 5.38 480 530 37.5 3,342.5 Guadalupe y Calvo 154 94 2.14 255 465 10.6 1,260 Parral (new) 2,283 262 0.25 281 19,215 18.1 20,572.5 Total Inferred 6,634 227 1.23 319 48,356 261.4 67,961.1
Silver-Gold-Lead-Zinc Resources
Tonnes (000s) Ag g/t Au g/t Ag Eq g/t Ag oz (000s) Au oz (000s) Ag Eq oz (000s) Zn% Pb% Indicated Guanaceví 363 208 0.26 302 2,420.5 3.1 2,653 0.78 1.32 Parral 1,631 49 0.90 117 2,589.9 47.2 6,129 2.87 2.86 Total Indicated 1,994 78 0.78 151 5,010.4 50.3 8,782.9 2.49 2.58 Inferred Guanaceví 488 132 0.16 293 2,076 2.5 2,263.5 1.36 2.54 Parral 1,303 63 0.88 129 2,658.9 36.9 5,456.4 2.55 2.28 Total Inferred 1,791 82 0.68 174 4,710 39.4 7,689.9 2.23 2.35
GROWTH WITH INTEGRITY 46
Notes es
1. Mineral Resources are not Mineral Reserves and do not have demonstrated economic viability. There is no certainty that any or all part of the Mineral Resources will be converted into Mineral Reserves. The estimate of Mineral Resources may be materially affected by environmental, permitting, legal, title, taxation, socio-political, marketing, or other relevant issues. 2. The Inferred Mineral Resource in this estimate has a lower level of confidence than that applied to an Indicated Mineral Resource and must not be converted to a Mineral
3. The Mineral Resources in this estimate were calculated using the Canadian Institute of Mining, Metallurgy and Petroleum (CIM), CIM Standards on Mineral Resources and Reserves, Definitions and Guidelines prepared by the CIM Standing Committee on Reserve Definitions and adopted by CIM Council. 4. Mineral Resources are exclusive of and in addition to Mineral Reserves. 5. Mineral Resource and Mineral Reserve cut-off grades are based on a 202 g/t silver equivalent for Guanaceví, 158 g/t silver equivalent for Bolañitos, 152 g/t silver equivalent for Villalpando Ascuncion ore zone of El Cubo and 218 g/t silver equivalent for Santa Cecilia ore zone of El Cubo, and 150 g/t silver equivalent for Terronera, El Compas, Guadalupe y Calvo and Parral Properties. 6. Metallurgical recoveries were 83.0% silver and 85.0% gold for Guanaceví, 84.3% silver and 87.7% gold for Bolañitos, and 87.0% silver and 86.7% gold for El Cubo. 7. Mining recoveries of 92% were applied for Mineral Reserve Estimate calculations. 8. Minimum mining widths were 0.8 metres for Mineral Reserve Estimate calculations. 9. Dilution factors for Mineral Reserve Estimate calculations averaged 26% for Guanaceví, 28% for Bolañitos, and 35% for El Cubo. Dilution factors are calculated based on internal stope dilution calculations and external dilution factors of 15% for cut and fill mining and 30% for long hole mining at Guanaceví, 28% and Bolañitos and 54% for long mining at El Cubo. 10. Silver equivalent grades are based on a 75:1 silver:gold ratio and calculated including only silver and gold. 11. Inferred Mineral Resources for Terronera includes the Terronera and Real Alto Area (Animas-Los Negros, El Tajo & Real veins). 12. The La Colorada structure (Parral) does not contain gold on an economic scale. 13. Price assumptions for Guanaceví, Bolañitos and El Cubo are US$17.26/oz for silver, US$1,232/oz for gold, US$0.82/lb for lead and US$0.90/lb for zinc. 14. Price assumptions for Terronera are US$18/oz for silver, US$1,250/oz for gold. 15. Price assumptions for El Compas are US$18/oz for silver, US$1,225/oz for gold. 16. Figures in the tables are rounded to reflect estimate precision; small differences generated by rounding are not material to the estimates
Godfrey Walton, M.Sc., P.Geo., President and COO of Endeavour, is the Qualified Person who reviewed and approved the technical information contained in these Mineral Reserve and Resource Estimates. A Quality Control sampling program of reference standards, blanks and duplicates has been instituted to monitor the integrity of all assay results. All samples are split at the local field office and shipped to ALS-Chemex Labs, where they are dried, crushed, split and 50 gram pulp samples are prepared for analysis. Gold and silver are determined by fire assay with an atomic absorption (AA) finish. The Mineral Resource Estimates for Terronera, El Compas and Parral were undertaken by Independent Qualified Persons Eugene Puritch, P.Eng., FEC, CET, Yungang Wu, P.Geo., and David Burga, P.Geo of P&E Mining Consultants Inc. Mr. Puritch has reviewed and approved the technical content of this press release with respect to the Terronera vein area, El Compas and new Parral. The Cometa property in Parral which is part of the Lead-Zinc portion of the table is based on a Technical report titled NI 43-101 Technical Report audit of the Mineral Resource Estimate for the Parral Project, Chuhuahua State, Mexico and filed Dec 15, 2010 and authored by William Lewis, B.Sc., Charley Z. Murahwi M.Sc. MAusIMM and Dibya Kanti Mukhopadhyay M.Sc. MAusIMM. This report is separate from the Parral Properties described by P&E Mining Consultants Inc. The resources on the veins (Animas-Negros, Tajo and Real) from the Terronera property were estimated as part of a 43-101 report authored by Michael J. Munroe dated March 27th 2014 and titled NI 43-101 Technical Report audit of the Mineral Resource estimate for the San Sebastian Project, Jalisco State,
47
Comparative Table of Consolidated Mine Operations Ore grades (g/t) Recovered ounces Recoveries (%)
Period Plant throughput (tonnes) Silver Gold Silver Gold Silver Gold Cash costs ($/oz Ag) AISC ($/oz Ag) Direct costs ($/tonne) Q1 2013 376,344 154 1.51 1,489,746 15,032 79.9 82.3 10.04 24.60 99.63 Q2 2013 393,070 165 1.96 1,535,396 22,212 73.6 80.4 10.53 26.80 96.45 Q3 2013 389,090 171 1.89 1,855,846 22,946 86.7 96.9 5.14 12.14 104.06 Q4 2013 379,480 181 1.78 1,931,717 17,686 87.3 81.6 7.46 14.24 90.72 Total 2013 1,537,984 168 1.78 6,813,069 75,578 82.1 85.6 7.92 18.31 97.00 Q1 2014 346,525 198 1.92 1,898,999 18,519 86.1 86.6 4.87 12.15 92.93 Q2 2014 339,276 178 1.59 1,669,609 15,131 86.1 87.4 9.87 20.48 103.58 Q3 2014 344,393 175 1.48 1,634,294 14,118 84.5 86.3 10.70 20.18 99.02 Q4 2014 374,212 191 1.49 2,009,172 15,127 87.3 84.4 8.33 15.37 89.63 Total 2014 1,404,406 185 1.62 7,212,074 62,895 86.2 86.1 8.31 16.79 96.11 Q1 2015 380,792 174 1.53 1,820,050 15,808 85.2 84.5 7.17 13.32 82.67 Q2 2015 371,745 180 1.32 1,769,741 13,047 82.4 83.0 8.60 16.86 82.93 Q3 2015 404,878 163 1.39 1,820,282 15,319 85.7 84.9 8.11 15.05 75.09 Q4 2015 406,387 156 1.40 1,732,765 15,433 84.9 84.3 9.76 17.33 80.39 Total 2015 1,563,802 167 1.41 7,178,666 59,990 85.4 84.7 8.39 15.62 80.18 Q1 2016 408,553 137 1.50 1,510,065 15,960 83.7 81.0 7.63 11.12 74.26 Q2 2016 377,198 148 1.58 1,551,851 15,649 86.2 81.9 5.37 10.53 73.01 Q3 2016 355,611 133 1.55 1,284,646 14,364 84.3 80.8 5.27 11.47 71.18 Q4 2016 317,555 123 1.35 1,088.845 11,402 87.0 83.0 9.39 20.11 70.72 Total 2016 1,458,917 136 1.50 5,435,407 57,375 85.3 81.7 6.78 12.43 72.42 Q1 2017 303,222 126 1.41 1,076,974 11,724 87.4 85.2 7.81 18.24 75.77 Q2 2017 303,943 135 1.58 1,143,788 13,058 86.6 84.6 8.36 20.46 84.01 Q3 2017 319,038 144 1.53 1,262,064 13,648 84.5 87 8.10 18.71 81.60 Q4 2017 349,924 152 1.56 1,436,962 14,577 84.1 83.3 7.97 12.70 84.38 Total 2017 1,279,873 140 1.54 4,919,788 53,007 85.4 83.9 8.06 16.96 82.36 Q1 2018 325,669 148 1.47 1,314,648 12,832 84.6 83.6 6.50 14.18 79.38
48
Ore grades (g/t) Recovered ounces Recoveries (%) Period Plant throughput (tonnes) Silver Gold Silver Gold Silver Gold Cash costs ($/oz Ag) AISC ($/oz Ag) Direct costs ($/tonne)
Q1 2013 106,653 233 0.34 640,616 942 80.2 80.8 16.70 27.75 113.61 Q2 2013 100,781 240 0.68 555,036 1,590 71.3 72.6 16.59 30.17 111.21 Q3 2013 107,480 265 0.70 715,080 1,978 78.0 82.1 12.98 19.18 111.06 Q4 2013 121,008 272 0.69 861,495 2,275 81.5 85.2 13.09 17.43 114.55 Total 2013 435,922 253 0.60 2,772,227 6,784 78.2 80.7 14.32 22.55 110.93 Q1 2014 106,813 350 0.77 1,005,781 2,273 83.7 86.0 8.30 11.94 103.90 Q2 2014 108,822 272 0.55 795,824 1,656 83.6 86.1 12.51 19.18 109.83 Q3 2014 105,241 278 0.59 761,272 1,627 81.0 82.1 11.99 16.62 105.23 Q4 2014 102,375 358 0.70 1,024,762 2,085 87.0 90.5 7.28 11.89 96.91 Total 2014 423,251 314 0.65 3,587,639 7,641 84.0 86.4 9.73 14.51 104.06 Q1 2015 106,106 300 0.63 853,106 1,877 83.4 87.3 8.23 11.16 87.34 Q2 2015 108,817 325 0.64 958,581 1,946 84.3 86.9 8.14 13.40 92.48 Q3 2015 111,469 285 0.58 867,292 1,792 84.9 86.2 7.98 12.76 79.15 Q4 2015 105,039 269 0.61 761,769 1,775 83.9 86.2 10.57 14.67 93.58 Total 2015 431,431 295 0.62 3,440,748 7,390 84.1 85.9 8.66 12.97 88.04 Q1 2016 98,776 249 0.56 651,731 1,568 82.4 88.5 8.09 12.95 71.92 Q2 2016 98,756 232 0.49 629,221 1,365 85.4 87.7 10.82 20.11 83.38 Q3 2016 82,059 235 0.51 542,385 1,163 87.5 86.4 11.12 21.53 93.24 Q4 2016 87,850 211 0.49 540,708 1,232 90.7 89.0 12.66 26.74 93.60 Total 2016 367,441 232 0.51 2,364,045 5,328 86.3 88.4 10.56 19.07 84.94 Q1 2017 87,599 213 0.49 530,683 1,192 88.5 86.4 12.85 23.78 94.99 Q2 2017 74,894 219 0.50 468,741 1,079 88.8 89.5 14.94 27.40 111.42 Q3 2017 74,649 249 0.57 522,907 1,224 87.5 89.5 13.68 23.47 117.15 Q4 2017 83,881 241 0.54 544,117 1,245 83.7 85.5 12.39 17.57 99.39 Total 2017 321,113 230 0.53 2,066,448 4,740 87.0 86.6 13.41 22.87 105.13 Q1 2018 78,971 224 0.63 489,163 1,443 86.0 90.2 15.31 22.62 120.63
49
50
Ore grades (g/t) Recovered ounces Recoveries (%) Period Plant throughput (tonnes) Silver Gold Silver Gold Silver Gold Cash costs ($/oz Ag) AISC ($/oz Ag) Direct costs ($/tonne)
Q1 2013 167,500 135 2.27 578,654 9,891 79.8 81.0 (0.06) 17.05 85.10 Q2 2013 202,472 160 2.84 810,414 15,751 77.8 85.2 (2.74) 11.81 75.50 Q3 2013 181,442 147 2.75 794,734 15,868 92.5 98.9 (8.10) (3.29) 84.57 Q4 2013 159,294 152 2.61 698,098 10,142 89.7 75.9 0.60 7.68 72.78 Total 2013 710,708 149 2.63 2,881,816 51,652 84.6 86.0 (2.87) 7.39 79.47 Q1 2014 142,412 144 2.72 572,851 10,640 86.9 85.4 (2.21) 3.85 85.27 Q2 2014 142,370 152 2.47 623,898 9,980 89.7 88.3 1.20 9.70 93.04 Q3 2014 137,683 149 2.20 588,159 8,588 89.2 88.2 2.93 11.75 87.98 Q4 2014 145,408 148 2.03 611,271 7,900 88.3 83.2 5.64 9.44 83.58 Total 2014 567,873 148 2.36 2,396,179 37,108 88.7 86.1 1.94 8.70 87.44 Q1 2015 136,076 139 2.30 521,117 8,421 85.7 83.7 0.17 5.74 74.00 Q2 2015 106,148 131 1.72 376,305 4,982 84.2 84.9 4.82 13.80 70.89 Q3 2015 109,124 105 1.95 300,988 5,397 81.7 78.9 7.68 14.40 70.17 Q4 2015 103,878 90 1.88 251,363 5,166 83.6 82.3 8.09 18.15 72.31 Total 2015 455,226 118 1.99 1,449,776 23,966 83.9 82.3 4.31 11.79 71.97 Q1 2016 137,128 94 2.33 334,569 8,449 80.7 82.2 (6.20) (3.55) 60.03 Q2 2016 136,322 80 2.38 276,885 8,470 79.0 81.2 (7.08) (4.25) 63.94 Q3 2016 132,686 76 2.30 255,350 7,875 78.7 80.3 (15.17) (11.16) 49.03 Q4 2016 101,568 71 2.22 185,813 5,926 80.1 81.7 (4.87) 1.02 54.35 Total 2016 507,704 81 2.31 1,052,617 30,720 79.6 81.5 (8.37) (4.77) 57.07 Q1 2017 94,351 66 2.40 168,723 6,218 84.3 85.4 (10.28) (3.82) 65.18 Q2 2017 113,875 78 2.27 231,106 6,965 80.9 83.8 (4.78) 3.61 66.60 Q3 2017 114,526 83 2.09 257,972 6,663 84.4 86.6 (0.52) 3.96 71.52 Q4 2017 124,172 86 2.18 280,712 7,204 81.8 82.8 (2.73) 1.01 67.04 Total 2017 446,924 80 2.24 934,238 26,910 81.3 83.6 (4.00) 1.62 67.68 Q1 2018 115,014 82 1.83 238,012 5,578 78.5 82.4 (2.77) 4.20 60.87
51
52
Ore grades (g/t) Recovered ounces Recoveries (%) Period Plant throughput (tonnes) Silver Gold Silver Gold Silver Gold Cash costs ($/oz Ag) AISC ($/oz Ag) Direct costs ($/tonne)
Q1 2013 102,191 103 1.48 270,446 4,199 79.9 86.4 15.30 32.86 108.85 Q2 2013 89,817 93 1.41 170,423 2,574 63.5 63.2 31.31 85.81 127.11 Q3 2013 100,168 112 1.62 346,032 5,101 95.6 97.8 18.61 32.27 131.83 Q4 2013 99,178 118 1.77 372,124 5,269 98.9 93.4 6.65 18.95 90.44 Total 2013 391,354 107 1.57 1,159,026 17,142 86.1 86.8 18.77 34.84 113.31 Q1 2014 97,300 110 2.01 320,367 5,606 93.1 89.2 6.27 27.66 92.08 Q2 2014 88,084 103 1.44 249,887 3,495 85.7 85.7 22.71 52.07 112.88 Q3 2014 101,469 102 1.42 284,863 3,903 85.6 84.3 23.10 47.46 107.56 Q4 2014 126,429 106 1.51 373,139 5,142 86.6 83.8 15.73 35.05 90.70 Total 2014 413,282 105 1.59 1,228,256 18,146 88.0 85.9 16.40 39.49 99.89 Q1 2015 138,610 113 1.46 445,827 5,510 88.5 84.7 13.24 26.44 87.61 Q2 2015 156,780 112 1.51 434,855 6,119 77.0 80.4 12.59 26.56 84.14 Q3 2015 184,285 124 1.54 652,002 8,130 88.7 89.1 8.48 18.48 75.50 Q4 2015 197,470 131 1.57 719,633 8,492 86.5 85.2 9.45 19.96 77.65 Total 2015 1,563,802 119 1.52 2,288,145 28,634 88.3 86.5 10.56 22.15 80.60 Q1 2016 172,649 108 1.38 523,765 5,943 87.4 77.6 15.87 18.11 86.91 Q2 2016 142,120 156 1.56 645,745 5,814 90.6 81.6 5.21 7.20 74.51 Q3 2016 140,866 128 1.46 486,911 5,326 84.0 80.5 9.16 11.60 79.20 Q4 2016 128,137 103 1.24 362,324 4,244 85.4 83.1 11.65 19.62 68.01 Total 2016 583,772 136 1.41 2,018,745 21,327 87.4 80.6 10.09 13.32 77.88 Q1 2017 94,351 111 1.31 377,568 4,314 87.2 84.5 8.52 20.00 70.12 Q2 2017 115,084 137 1.60 444,031 5,014 87.6 84.7 7.95 21.60 83.38 Q3 2017 129,863 137 1.60 465,351 5,803 81.4 86.9 6.37 17.95 78.13 Q4 2017 141,871 157 1.61 612,133 6,128 85.5 83.4 8.78 13.56 90.69 Total 2017 511,836 136 1.55 1,919,102 21,357 85.8 83.7 7.93 17.80 80.90 Q1 2018 131,684 161 1.65 587,473 5,811 86.2 83.2 2.93 11.22 70.81
53
54
29% 12% 2% 17% 5% 20% 4% 3% 8%
Guanaceví aceví
Labour Re-Agents & Grinding Fuel Power Royalties Contractor Refining Explosives Tolled Ore
34% 8% 3% 18% 20% 11% 6%
Bolañi ñito tos
Labour Re-agents & Grinding Fuel Power Contractor Refining Explosives 38% 14% 3% 11% 27% 7%
El El Cubo
Labour Re-agents & Grinding Fuel Power Contractor Explosives 32% 11% 3% 17% 2% 21% 5% 5% 4%
Consolidated dated
Labour Re-agents & Grinding Fuel Power Royalties Contractor Refining Explosives tolled Ore
55
Corpor
ate Social al Integrity grity and Sustain inable ble Develop lopment, ent, CSR The Endeavo vour r Way We receive ive annual l awards for the way we do business s
GROWTH WITH INTEGRITY 56
Who we e are re and what at we do:
We find, build and operate quality silver mines in a sustainable way to create real value for all stakeholders Our goal is to continue growing to become a premier, low cost senior producer in the silver mining sector By continually improving what we do and how we do it, we aim to make a positive difference in people’s lives Doing what’s right and pursuing a sustainable approach to mining are core to building a successful enterprise
We car are e about: t:
Ensuring the health and safety of our people Protecting and remediating the environment Building human capacity through education Pursuing a philosophy of continuous improvement
We Value ue Integr tegrity ty
GROWTH WITH INTEGRITY 57
In 2008 Endeavour started formalizing its sustainable development policies:
GROWTH WITH INTEGRITY 58
Committee charters and policies on Ethical Code of Conduct, Anti-Bribery and Corruption, Whistle Blower, Disclosure and Advance Notice
Diversity and Sustainability
all stakeholders including shareholders, investors, bankers, analysts, employees, communities, ejidos, governments, union, church, contractors, suppliers, small-scale miners and media List of Policies ies:
GROWTH WITH INTEGRITY 59
to fulfil community and sustainability objectives
acquisition of properties, mines and plants exploration to discover new orebodies in historic mining districts development to open new mines and refurbish and expand old mines, plants and facilities operations to create 1,700 employee jobs and 1,000 contractor jobs direct economic impact on 8,100 people (3:1 ratio) indirect economic impact on another 8,100 people such as suppliers and services; 97% in Mexico taxes 16% IVA, 30% corporate, 7.5% EBITDA, 0.5% gross royalty
GROWTH WITH INTEGRITY 60
employee health and safety is our #1 priority, governed by extensive safety policies and practices
safety induction, daily safety procedures, regular refresher courses, job site audits and each mine has award-winning first aid and mine rescue teams
employees including annual medical checkups, disease and occupational health tests, drug and alcohol tests, lifestyle and fitness counselling
governments to provide medical, dental, and optical services, and lifestyle and addiction counselling
GROWTH WITH INTEGRITY 61
communities
school scholarships in Mexico, and online courses to complete high school diplomas, technical and self-employment courses
unemployed career skills like operating dump trucks, scoop trams, jumbo drills followed by job offers
GROWTH WITH INTEGRITY 62
waste recycling and disposal and biodiversity
North American standards – dry stack at Guanaceví, a unique drainage system at Bolañitos, and new facilities at El Cubo
areas disturbed by Endeavour but also historic areas
GROWTH WITH INTEGRITY 63
celebrations; we sponsor sports teams, kids camps and field trips, and an annual 10 km race to promote fitness; we help upgrade local buildings, schools, churches and roads
pastry making, confections, jewelry, tourist gifts, clothing and mops
fresh water supply, to proper sewage disposal, to new community buildings, to tourist mine
GROWTH WITH INTEGRITY 64
reporting of its sustainability activities, based on stakeholder engagement and materiality assessment
for feedback on a full range of interests, and every two years, we conduct a materiality review to rank what is most important both internally and externally in order to adjust our sustainability goals and programs
environment and social are each reported separately in our Annual Review and Sustainability Report, including a review of our progress each year and resetting our goals