In Introduct ctio ion t to Im Improve K e KSU SU Assessment - - PowerPoint PPT Presentation

in introduct ctio ion t to im improve k e ksu su
SMART_READER_LITE
LIVE PREVIEW

In Introduct ctio ion t to Im Improve K e KSU SU Assessment - - PowerPoint PPT Presentation

In Introduct ctio ion t to Im Improve K e KSU SU Assessment Team v Anissa Vega, , Interim Assistant Vice President for Curriculum and Academic Innovation and Associate Professor of Instructional Technology v Donna DeGrendel, Associate


slide-1
SLIDE 1

In Introduct ctio ion t to Im Improve K e KSU SU

slide-2
SLIDE 2

Assessment Team

v Anissa Vega, , Interim Assistant Vice President for Curriculum and Academic Innovation and Associate Professor of Instructional Technology v Donna DeGrendel, Associate Director of Assessment v Michelle Lee, Assessment Coordinator

slide-3
SLIDE 3

Workshop Outline

  • Introductions and Overview
  • Continuous Improvement Cycle
  • Online System
  • Resources
  • Questions and Discussion
slide-4
SLIDE 4

History and Purpose

  • Launched in Fall 2016
  • Purpose is simple: To improve KSU
  • Emphasis on use of results for improvement
  • Focus on areas with the most room for improvement
  • Helps us better serve students and internal customers, fulfill
  • ur mission and vision, and live our values
slide-5
SLIDE 5

Continuous Improvement in Higher Ed

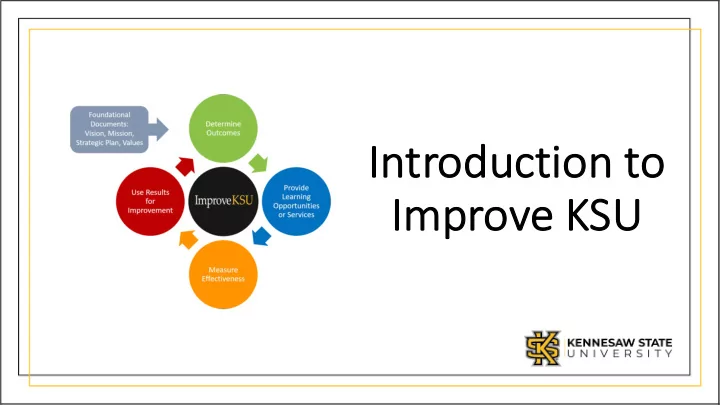
Assessment should be meaningful and inform the work.

slide-6
SLIDE 6

Who Participates at KSU?

  • Educational Programs
  • Academic and Student Services
slide-7
SLIDE 7

KSU’s Continuous Improvement Cycle

slide-8
SLIDE 8

Determine Outcomes

  • Student Learning Outcomes: Expected

knowledge, skills, attitudes, or competencies that students are expected to acquire

  • Performance Outcomes: Specific goals or

expected results for an academic or student services units

  • Where is there the most room for improvement?
slide-9
SLIDE 9

q Specific, Strategic q Measurable, Motivating, Meaningful q Attainable, Action-Oriented, Aligned q Relevant, Result-Oriented, Realistic q Time-bound, Trackable

slide-10
SLIDE 10

Student Learning Outcomes (SLOs)

  • Educational programs
  • 3 SLOs per program
  • Knowledge/skill areas with a need for

improvement

  • Aligned with industry standards/needs
  • Written in clear, succinct language
  • Use of action verbs (Bloom’s Taxonomy)
slide-11
SLIDE 11
slide-12
SLIDE 12

SLO Examples

  • Students will demonstrate effective oral communication skills.
  • Program graduates will be able to define and interpret

methodological and statistical constructs.

  • Students will be able to explain how key values and social practices

associated with American life have evolved in distinct historical periods.

slide-13
SLIDE 13

Pitfalls in Identifying SLOs

  • Failing to involve faculty
  • Identifying too many SLOs for

improvement

  • Focusing on multiple knowledge/skill

areas within one outcome

  • Writing SLOs in vague terms
  • Failing to define observable

behaviors

slide-14
SLIDE 14

Performance Outcomes (POs)

  • An area of unit performance with a

need for improvement

  • 3 POs per academic and student

services unit

  • Currently POs are optional for

educational programs, departments, and colleges

slide-15
SLIDE 15

Performance Outcome Examples: Academic and Student Services

  • Increase internal/external customer satisfaction
  • Increase the efficiency of the ______ process
  • Improve staff morale
  • Decrease department turnover
  • Decrease expenditures/costs related to ______
  • Enhance staff knowledge or skills (be specific)
  • Expand services offered to campus constituents
  • Increase funding from grants and contracts
slide-16
SLIDE 16

Performance Outcome Examples: Student Affairs

PO1 - Student Learning PO2 - Program Performance

  • Improve the alignment of programming with student needs
  • Increase student participation in programs

PO3 - Retention, Progression, Graduation

  • Improve Student Affairs’ impact on RPG through targeted

programming and services

slide-17
SLIDE 17

Performance Outcome Examples: Colleges, Educational Departments, and Programs (optional)

  • Increase utilization of advising services
  • Reduce bottlenecks in course scheduling
  • Increase graduate school acceptances prior to KSU graduation
  • Increase certification/licensing exam pass rate
  • Increase research productivity
  • Increase community engagement of faculty/students
slide-18
SLIDE 18

Pitfalls in Identifying POs

  • Failing to involve staff and/or faculty
  • Focusing on “easy” outcomes just to

comply with a requirement

  • Not using improvement language
  • Focusing on one-time projects that are

not measured over time

  • Listing strategies for improvement

instead of an outcome or measure

slide-19
SLIDE 19

Provide Learning Opportunities or Services

slide-20
SLIDE 20

Measure Effectiveness

  • Specific method used to collect evidence of the outcome
  • At least two measures per outcome
  • Individual items on an assessment instrument may be considered

separate measures.

  • The same instrument may be used to assess different outcomes.

ü Rubric or exam items ü Internship evaluation items ü Survey items ü Focus group questions

slide-21
SLIDE 21

Measures of SLOs

Direct Measures:

  • Must have at least one
  • Tangible, visible, and compelling evidence of what students have

learned

  • Usually assessed by instructor or individuals with content expertise/

knowledge Indirect Measures:

  • Signs or perceptions of student learning
  • Self-assessments or surveys
slide-22
SLIDE 22

Example SLO Measures

DIRECT MEASURES OF STUDENT LEARNING (at least one per outcome; two are preferred):

Exam item • Assignment, project, or presentation rubric item • Licensure/professional exam item • Portfolio assessed with a rubric • Pre/post-test item • Thesis/dissertation defense rubric • Comprehensive exam item • Standardized test item • Internship supervisor evaluation • Employer rating of student skills

INDIRECT MEASURE OF STUDENT LEARNING (may supplement direct measures):

Student self-assessment of skills using a rubric or self-evaluation form

slide-23
SLIDE 23

Measures of POs

  • Direct Measures: Tangible, visible, and

compelling evidence of the outcome

  • Indirect Measures: Signs or perceptions
  • f the outcome
  • Quantitative: Numerical data
  • Qualitative: Lists, themes, or descriptive

analyses

slide-24
SLIDE 24

Example PO Measures

Increase classroom utilization rate across the campus Ø Percent classroom utilization for 8am to 5pm, Monday - Friday Ø List of classrooms currently not being utilized regularly Decrease the average number of days for work order completion Ø Average number of days for work order completion Ø Business process analysis of work order completion (including list/flow chart of steps and issues that cause delays) Increase internal customer service Ø Survey item(s) related to internal customer service Ø List of themes from open-ended comments on survey Ø Number and list of complaints from internal customers

slide-25
SLIDE 25

Outcomes and Measures: Guiding Questions

What is the area of improvement/focus for each outcome?

  • What is the expectation related to student learning or unit

performance?

  • Is the outcome clearly articulated?

Does the outcome follow the SMART mnemonic? Are the measures appropriate for the outcomes? What, if any, challenges might arise during implementation of the plan?

slide-26
SLIDE 26

Pitfalls in Measuring Effectiveness

  • Failing to involve faculty and staff
  • Failing to use existing measures
  • Using measures that are too holistic (i.e.,

course grades as measures of SLOs)

  • Attempting to measure too many things
  • Failing to collect the data, or creating

unmanageable data collection processes

  • Setting arbitrary targets (targets are optional)
slide-27
SLIDE 27

Use Results for Improvement

Analyze and summarize the data ü Reported annually ü Means and/or frequency distributions ü Graphs to visualize results and illustrate trends

slide-28
SLIDE 28

Use Results for Improvement

Identify trends and strategies for improvement related to the

  • utcome

ü Required every 3 years; option to add the template annually if desired ü Create an implementation plan for strategies

Discuss results and strategies for improvement with supervisor and faculty/staff

slide-29
SLIDE 29

Use Results for Improvement: Guiding Questions

What are the big take-a-ways from the results?

  • What are the specific problem areas?

What factors are contributing to the areas for improvement?

  • How can we address these factors?

What is the overall strategy for improvement?

  • What are the specific action steps needed to implement the strategy?
  • What are the timeframes for each action step?

Who else needs to be involved? What resources do we need?

slide-30
SLIDE 30

Pitfalls in Using Results for Improvement

  • Over-complicating the analyses or

written report

  • Failing to involve others
  • Failing to implement identified strategies

for improvement

  • Implementing too many strategies
  • Failing to improve upon an ineffective

assessment process

slide-31
SLIDE 31

Review/Modify the Assessment Plan

  • Ensure Outcomes are still meaningful and a

priority for improvement

  • Review and modify Measures as needed

(upload in the Measures field)

  • Eventually use the same Outcomes and

Measures in order to see improvement over time

  • Improve the process of collecting data if

needed

slide-32
SLIDE 32

Example Timeline

  • Sept. 30,

2018 Submit Assessment Plan

  • Oct. 1, 2018 -

June 30, 2019 Collect data July 1, 2019 - September 29, 2019 Analyze data

  • Sept. 30,

2019 Submit Improvement Report

slide-33
SLIDE 33

Cohort Schedule and Lists

q Annual reporting of Results q Interpretation and Trends / Strategies for Improvement every 3 years (if not added, it is not required)

slide-34
SLIDE 34

Process Map: Educational Programs

slide-35
SLIDE 35

Process Map: Academic and Student Services

slide-36
SLIDE 36

Online System

  • Link to Online System: improve.kennesaw.edu
  • Feedback on Assessment Plan and Improvement Report
  • Templates
  • Report Uploads (with approval only)
  • Downloading a PDF of the plan/report
slide-37
SLIDE 37

Other Uses of Assessment Data

  • Inform the development of university strategic plan

through common themes

  • Measure progress for university and unit strategic plans
  • University and specialized

accreditation/reaffirmation

  • Academic Program Review
  • Other assessment initiatives
slide-38
SLIDE 38

Culture of Continuous Improvement

  • Begin with a core set of institutional values
  • Communicate expectations and model the process
  • Involve all facets of the university
  • Utilize and build on existing tools and programs
  • Identify and communicate common ties among initiatives
  • Communicate how assessment results have been used for improvement
  • Keep continuous improvement “top of mind” and part of the institutional lexicon
  • Enhance data/information literacy skills among faculty and staff
  • Encourage academic innovation -- test novel or innovative solutions
  • Integrate with HR systems: job descriptions, performance reviews, recognition and

reward systems

slide-39
SLIDE 39

KSU Resources

Improve KSU Website

  • Online system guide
  • Resource documents
  • Cohort Schedule and Lists

Written Qualitative Feedback

  • Assessment Plan Feedback
  • Improvement Report Feedback

Individual and Team Consultations Drop-In Help Sessions Workshops

slide-40
SLIDE 40

Helpful Links

Online system: http://improve.kennesaw.edu/ Improve KSU Website: https://cia.kennesaw.edu/assessment/improve-ksu.php A Simple Model for Learning Improvement: Weigh Pig, Feed Pig, Weigh Pig http://www.learningoutcomeassessment.org/documents/Occasional_Paper_23.pdf Association of American Colleges & Universities (AAC&U) VALUE Rubrics http://www.aacu.org/value-rubrics IDEA Paper #45: Assessing Your Program-Level Assessment Plan http://ideaedu.org/wp-content/uploads/2014/11/IDEA_Paper_45.pdf

slide-41
SLIDE 41

Assessment Team Email: assessment@kennesaw.edu

Thank you for attending!