In Introduct ctio ion t to Im Improve K e KSU SU KSUs - - PowerPoint PPT Presentation

in introduct ctio ion t to im improve k e ksu su
SMART_READER_LITE
LIVE PREVIEW

In Introduct ctio ion t to Im Improve K e KSU SU KSUs - - PowerPoint PPT Presentation

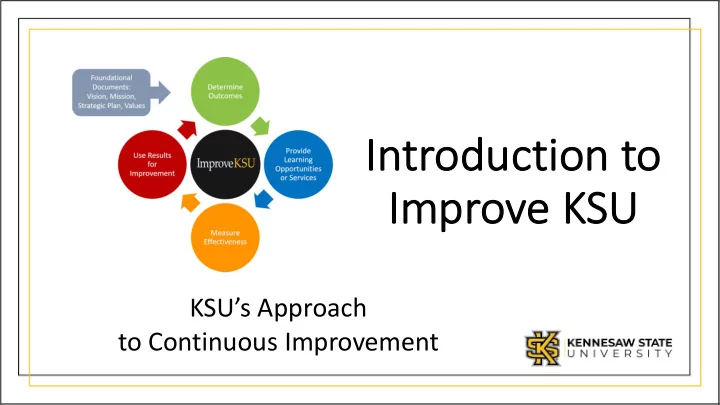
In Introduct ctio ion t to Im Improve K e KSU SU KSUs Approach to Continuous Improvement As Assessment Team v Anissa Vega, Interim Assistant Vice President for Curriculum and Academic Innovation and Associate Professor of


slide-1
SLIDE 1

In Introduct ctio ion t to Im Improve K e KSU SU

KSU’s Approach to Continuous Improvement

slide-2
SLIDE 2

As Assessment Team

v Anissa Vega, Interim Assistant Vice President for Curriculum and Academic Innovation and Associate Professor of Instructional Technology v Donna DeGrendel, Associate Director of Assessment v Michelle Lee, Assessment Coordinator v Juliana Peterson, Graduate Research Assistant

slide-3
SLIDE 3

Wo Workshop Outline

  • Introductions and Overview
  • Continuous Improvement Cycle
  • Online System
  • Resources
  • Questions and Discussion
slide-4
SLIDE 4

His History and P and Pur urpo pose se

  • Launched in Fall 2016
  • Purpose is simple: To improve KSU
  • Emphasis on use of results for improvement
  • Focus on areas with the most room for improvement
  • Helps us better serve students and internal customers, fulfill
  • ur mission and vision, and live our values
slide-5
SLIDE 5

Wh What is s Asse ssessm ssment?

Assessment answers the question, “How well are we doing what we intend to do?”

  • Deciding what we want students to learn and making sure they

learn it

  • Determining the effectiveness of our academic/student services
  • Telling our story: What makes our college/program unique? How

effective are we in meeting student, industry, and societal needs?

Source: Suskie (2018)

slide-6
SLIDE 6

Wh Why do Asse ssessm ssment?

Assessment has three fundamental purposes (Suskie, 2018):

  • 1. Ensuring and improving

educational quality

  • 2. Stewardship
  • 3. Accountability

Why are you doing assessment? Extrinsic vs. Intrinsic Motivation

slide-7
SLIDE 7

KSU’s Assessment Guiding Princi ciples

  • Supports KSU’s mission and strategic priorities
  • Beyond mere compliance or reporting
  • Focused on incremental improvement
  • Meaningful and manageable
  • Collaborative at all stages
  • Use of embedded, direct assessments
  • Continuous, flexible, systematic, and equitable
  • Learning outcomes align with employer needs

and/or industry standards

slide-8
SLIDE 8

Wh Why Not Use se Grades? s?

Grades or holistic scores:

  • Can point to potential areas of concern, but they should not be

used as direct measures of student learning

  • Lack granular information about what students have and have not learned
  • Make it difficult to determine specific and targeted strategies for

improvement

  • May include factors other than student learning (i.e., participation,

attendance, effort, etc.) Assessment goes beyond grading by systematically examining patterns of student learning across courses and programs and using this information to improve educational practices (Suskie, 2018).

slide-9
SLIDE 9

Pr Program/Course Design Triangle

Ø Learning Outcomes: What do we want students to

know or do when they complete this course/program?

Ø Instruction: What is the best way to teach the learning

  • utcomes and prepare students for assessments?

Ø Assessment: What tasks or instruments will provide

evidence of whether students have achieved the learning outcomes?

Ø Measure à Change à Measure

https://ctl.wiley.com/course-design-triangle/ Learning outcomes, instructional strategies, and assessments should align and support one another. Misalignment hinders student learning and motivation. Source:

slide-10
SLIDE 10

KSU’s Continuous Improvement Cycl cle

slide-11
SLIDE 11

De Deter ermi mine e Outcomes mes

  • Student Learning Outcomes: Expected

knowledge, skills, attitudes, or competencies that students are expected to acquire

  • Performance Outcomes: Specific goals or

expected results for an academic or student services unit

  • Where is there the most room for improvement?
slide-12
SLIDE 12

q Specific, Strategic q Measurable, Motivating, Meaningful q Attainable, Action-Oriented, Aligned q Relevant, Result-Oriented, Realistic q Time-bound, Trackable

slide-13
SLIDE 13

St Studen ent Lea Learning g Outcomes es (SL SLOs) s)

  • Educational programs
  • 3 SLOs per program
  • Knowledge/skill areas with a need for

improvement

  • Aligned with industry standards/needs
  • Written in clear, succinct language
  • Use of action verbs (Bloom’s Taxonomy)
slide-14
SLIDE 14

Are learning

  • utcomes
  • bservable and

measurable? Do learning

  • utcomes align

with the expected level of mastery for the course and for the degree program?

Graphic Source: Vanderbilt University Center for Teaching Revised Bloom’s Taxonomy: Anderson et al. (2001)

slide-15
SLIDE 15

Ar Are the le lear arnin ing outcome mes me meas asurab able le?

Not Measurable: Measurable

Students will be familiar with… Students will identify (or list) the… Students will know the difference between… Students will summarize the difference between… Students will think critically about… Students will evaluate the evidence… Students will compare and contrast… Students will construct an argument for… Students will understand the principles of… Students will apply the principles of… Students will appreciate… Students will articulate the importance of… Students will learn how to… Students will demonstrate…

slide-16
SLIDE 16

SL SLO Examples es

  • Students will demonstrate effective oral communication skills.
  • Program graduates will define and interpret methodological and

statistical constructs.

  • Students will to explain how key values and social practices

associated with American life have evolved in distinct historical periods.

slide-17
SLIDE 17

De Determin mine Outcome mes: Guid idin ing Qu Questio ions

  • What do we want students to get out of this learning experience? What do we want them to

be able to do long after the course is completed? Why are those things important?

  • What do our students do after they graduate? What are the most important things they need

for success in those pursuits?

  • What do we value most about our discipline? According to the major authorities in our

discipline, what are the most important things students should learn?

  • How does this course relate to other courses in this program, to other disciplines that students

may be studying, or to the general education curriculum?

  • What specific learning activities will help students achieve the learning outcomes?
  • How will we know if students have achieved the learning outcomes?
  • What assessments will best provide evidence of outcome achievement?

Source: Suskie (2018)

slide-18
SLIDE 18

Pit Pitfalls alls in in Identif ifyin ing SLOs

  • Failing to involve faculty
  • Identifying too many SLOs for

improvement

  • Focusing on multiple knowledge/skill

areas within one outcome

  • Writing SLOs in vague terms
  • Failing to define observable

behaviors

slide-19
SLIDE 19

Performance ce Outcomes (POs)

  • An area of unit performance with a need

for improvement

  • 3 POs per academic or student services

unit

  • Currently POs are optional for

educational programs, departments, and colleges

slide-20
SLIDE 20

Performance ce Outcome Examples: Academic c or Student Service ces Unit

  • Increase internal/external customer satisfaction
  • Increase productivity or service utilization
  • Increase the efficiency of the ______ process
  • Improve staff morale; decrease turnover
  • Decrease expenditures/costs related to ______
  • Enhance staff knowledge or skills related to ______
  • Expand services offered to campus constituents
  • Increase funding from grants and contracts
slide-21
SLIDE 21

Pe Performance Outcome Examples: Colleges, Educational De Departments, , and Progr grams (o (optional)

  • Increase retention, progression, and/or graduation rates
  • Decrease time-to-completion
  • Reduce bottlenecks in course scheduling; increase course sections
  • Increase high impact practices
  • Increase online/hybrid offerings
  • Increase use of OERs (open educational resources)
  • Improve student satisfaction or course evaluation scores
  • Increase research productivity or external grants
  • Increase employment or graduate school acceptance prior to KSU graduation
  • Increase certification/licensing exam pass rate
  • Increase community engagement of faculty/students
slide-22
SLIDE 22

Pitfalls in Identifying POs

  • Failing to involve staff and/or faculty
  • Focusing on “easy” outcomes just to

comply with a requirement

  • Not using improvement language
  • Focusing on one-time projects that are

not measured over time

  • Listing strategies for improvement

instead of an outcome or measure

slide-23
SLIDE 23

Provide Learning Opportunities or Services

slide-24
SLIDE 24

Measure Effect ctiveness

  • Specific method used to collect evidence of the outcome
  • At least two measures per outcome, at least one direct measures
  • Individual items on an assessment instrument may be used as

separate measures; helps guide specific strategies for improvement

  • The same instrument may be used to assess different outcomes

ü Rubric items (direct) ü Exam items (direct) ü Internship evaluation items (direct) ü Self-assessment (indirect) ü Survey items (indirect) ü Focus group questions (indirect)

slide-25
SLIDE 25

Measures of SLOs

Direct Measures:

  • Must have at least one
  • Tangible, visible, and compelling evidence of what

students have learned

  • Usually assessed by instructor or individuals with

content expertise/ knowledge Indirect Measures:

  • Signs or perceptions of student learning
  • Self-assessments or surveys
slide-26
SLIDE 26

Example SLO Measures

DIRECT MEASURES OF STUDENT LEARNING (at least one per outcome; two are preferred):

Exam item • Assignment, project, or presentation rubric item • Licensure/professional exam item • Portfolio assessed with a rubric • Pre/post-test item • Thesis/dissertation defense rubric • Comprehensive exam item • Standardized test item • Internship supervisor evaluation • Employer rating of student skills

INDIRECT MEASURE OF STUDENT LEARNING (may supplement direct measures):

Student self-assessment of skills using a rubric or self-evaluation form

slide-27
SLIDE 27

Me Measur ures of POs

  • Direct Measures: Tangible, visible, and

compelling evidence of the outcome

  • Indirect Measures: Signs or perceptions
  • f the outcome
  • Quantitative: Numerical data
  • Qualitative: Lists, themes, or descriptive

analyses

slide-28
SLIDE 28

Ex Example PO PO Measures

Increase classroom utilization rate across the campus Ø Percent classroom utilization for 8am to 5pm, Monday - Friday Ø List of classrooms currently not being utilized regularly Decrease the average number of days for work order completion Ø Average number of days for work order completion Ø Business process analysis of work order completion (including list/flow chart of steps and issues that cause delays) Increase internal customer service Ø Survey item(s) related to internal customer service Ø List of themes from open-ended comments on survey Ø Number and list of complaints from internal customers

slide-29
SLIDE 29

Me Measure Effecti tiveness: : Guiding Questi tions

q Are the measures appropriate for the outcomes? q Do we have two measures for each outcome? q Do we have at least one direct measure of student learning for each

  • utcome?

q Are the measures sufficiently granular to collect specific evidence of student learning or unit performance (i.e., exam or rubric items as

  • pposed to holistic scores or percentages)?

q How will the assessment data be analyzed? q What, if any, challenges might arise during data collection?

slide-30
SLIDE 30

Pitfalls in Measuring Effect ctiveness

  • Failing to involve faculty and staff
  • Failing to use existing measures
  • Using measures that are too holistic (i.e.,

course grades as measures of SLOs)

  • Attempting to measure too many things
  • Failing to collect the data, or creating

unmanageable data collection processes

  • Setting arbitrary targets (targets are optional)
slide-31
SLIDE 31

Us Use Results for Improvement

Analyze and summarize the data

ü Means and frequency distributions ü Graphs to visualize results and illustrate trends

Identify trends and strategies for improvement related to the outcome Measure à Change à Measure

slide-32
SLIDE 32

Use Results for Improvement

Identify trends and strategies for improvement related to the

  • utcome

ü Required every 3 years; option to add the template annually if desired ü Create an implementation plan for strategies

Discuss results and strategies for improvement with supervisor and faculty/staff

slide-33
SLIDE 33

Im Improvem emen ent P t Planning: G Guiding Q Ques esti tions

Share results and discuss with faculty team:

What are the big take-aways from the results? Where are students struggling the most? What factors are contributing to the results?

  • Perform a root cause analysis (the 5 whys; fishbone diagram)

What is the overall strategy for improvement?

  • What are the specific action steps needed to implement the strategy?
  • What are the timeframes for each action step?
  • Who else needs to be involved? What resources do we need?

Should the assessment plan/process be modified?

  • Are the learning outcomes appropriate?
  • Are the measures effective? Do they demonstrate acceptable reliability and validity?
  • How can our data collection process be improved?
slide-34
SLIDE 34

Po Possible Interventions

Changes in curriculum, such as:

ü Curriculum map ü Prerequisites ü Assignments ü Sequencing ü Amount of time devoted to concept ü Addition of concepts or practice opportunities ü Assessment instruments

Test novel or innovative solutions

If a change does not lead to improvement, it’s

  • kay -- try something else
slide-35
SLIDE 35

Resources for Improving Instructional Strategies

NEA - Higher Education Best Practices - Teaching & Learning U of IL - Teaching & Learning Resources U of Leicester - Effective Teaching Strategies The Chronicle of Higher Ed - Here’s How to Make Your Teaching More Inclusive Vanderbilt U - Center for Teaching Guides MERLOT - Resource Collection Faculty Focus - Higher Ed Teaching Strategies

slide-36
SLIDE 36

Pi Pitfalls in Using Res esults for r Im Improvem emen ent

  • Over-complicating the analyses or

written report

  • Failing to involve others
  • Failing to implement identified strategies

for improvement

  • Implementing too many strategies
  • Failing to improve upon an ineffective

assessment process

slide-37
SLIDE 37

Review/Modify y the Assessment Plan

  • Ensure Outcomes are still meaningful and a

priority for improvement

  • Review and modify Measures as needed

(upload in the Measures field)

  • Eventually use the same Outcomes and

Measures in order to see improvement over time

  • Improve the process of collecting data if

needed

slide-38
SLIDE 38

Ex Example T ample Timeline imeline

Fall 2019 Submit Assessment Plan August 2019 - June 2020 Collect data July 2020 – October 15, 2020 Analyze data October 16, 2020 Submit Improvement Report

slide-39
SLIDE 39

Coh Cohor

  • rt S

Schedule a and L Lists

q Annual reporting of Results q Interpretation and Trends / Strategies for Improvement every 3 years (if not added, it is not required)

slide-40
SLIDE 40
slide-41
SLIDE 41
slide-42
SLIDE 42

On Online System

  • Link to Online System: improve.kennesaw.edu
  • Feedback on Assessment Plan and Improvement Report
  • Templates
  • Report Uploads (with approval only)
  • Downloading a PDF of the plan/report
slide-43
SLIDE 43

Ot Other Use ses s of Asse ssessm ssment Data

  • Inform the development of university strategic plan

through common themes

  • Measure progress for university and unit strategic plans
  • University and specialized

accreditation/reaffirmation

  • Academic Program Review
  • Other assessment initiatives
slide-44
SLIDE 44

Cu Cultu ture e of Co Conti tinuous Imp Improvemen ement

  • Begin with a core set of institutional values
  • Communicate expectations and model the process
  • Involve all facets of the university
  • Utilize and build on existing tools and programs
  • Identify and communicate common ties among initiatives
  • Communicate how assessment results have been used for improvement
  • Keep continuous improvement “top of mind” and part of the institutional lexicon
  • Enhance data/information literacy skills among faculty and staff
  • Encourage academic innovation -- test novel or innovative solutions
  • Integrate with HR systems: job descriptions, performance reviews, recognition and

reward systems

slide-45
SLIDE 45

KSU Resource ces

Improve KSU Website

  • Online system guide
  • Resource documents
  • Cohort Schedule and Lists

Written Qualitative Feedback

  • Assessment Plan Feedback
  • Improvement Report Feedback

Individual and Team Consultations Drop-In Help Sessions Workshops

slide-46
SLIDE 46

Hel Helpful Li Links

Online system: http://improve.kennesaw.edu/ Improve KSU Website: https://cia.kennesaw.edu/assessment/improve-ksu.php A Simple Model for Learning Improvement: Weigh Pig, Feed Pig, Weigh Pig http://www.learningoutcomeassessment.org/documents/Occasional_Paper_23.pdf Association of American Colleges & Universities (AAC&U) VALUE Rubrics http://www.aacu.org/value-rubrics

slide-47
SLIDE 47

Additional Resource ces

Anderson, L. W., Krathwohl, D. R., Airasian, P. W., Cruikshank, K. A., Mayer, R. E., Pintrich, P. R., Raths, J., & Wittrock, M. C. (2001). A taxonomy for learning, teaching, and assessing: A revision of Bloom’s Taxonomy of Educational Objectives. New York: Longman Angelo, T. A., & Cross, K. P. (1993). Classroom Assessment Techniques: A Handbook for College

  • Teachers. San Francisco: Jossey-Bass.

National Institute for Learning Outcomes Assessment. (2018, March). Mapping learning: A toolkit of resources. Urbana, IL: University of Illinois at Urbana-Champaign, National Institute for Learning Outcomes Assessment (NILOA). Suskie, L. (2018). Assessing Student Learning: A Common Sense Guide. San Francisco: Jossey- Bass.

slide-48
SLIDE 48

Assessment Team Email: assessment@kennesaw.edu

Thank you for attending!