
SLIDE 1
Fraser McPhee
@FarmerFrase
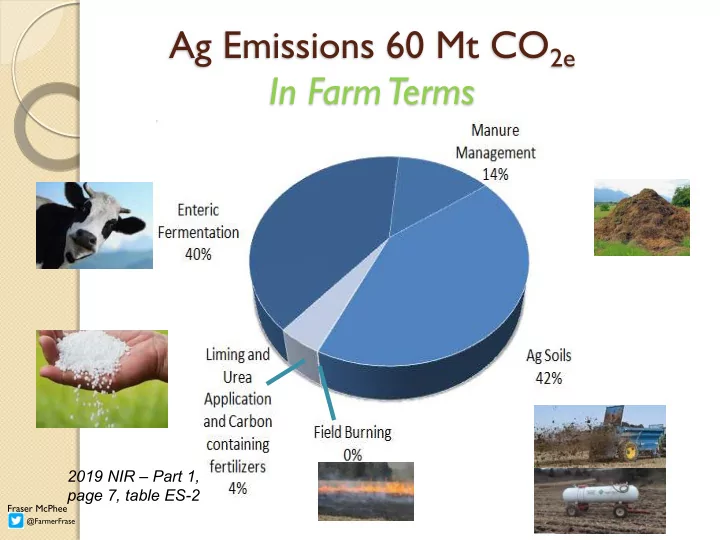
Ag Emissions 60 Mt CO2e In Farm Terms
2019 NIR – Part 1, page 7, table ES-2
In Farm Terms 2019 NIR Part 1, page 7, table ES-2 Fraser McPhee - - PowerPoint PPT Presentation
Ag Emissions 60 Mt CO 2e In Farm Terms 2019 NIR Part 1, page 7, table ES-2 Fraser McPhee @FarmerFrase Canadian 2017 Emissions by IPCC Sector with Cropland and Grain 100 60 3 57 19 187 383 14 Ag/Forestry Waste Net 19Mt
Fraser McPhee
@FarmerFrase
2019 NIR – Part 1, page 7, table ES-2
Fraser McPhee
@FarmerFrase
100 Mt Carbon Stored in Grain
Waste
Net 19Mt 3 Mt Carbon Stored Manufacturing Fertilizer
Industry
Net 54Mt
100 3 60 57 19
Agriculture has a net capture of 33Mt CO2e when soil and grain are included
187 383
Biofuels & End users
14
Energy
Net 583Mt
Ag/Forestry
7 Mt Cropland LULUCF 2019 NIR – Part 1, table ES-2
Fraser McPhee
@FarmerFrase
Fraser McPhee
@FarmerFrase
Fraser McPhee
@FarmerFrase
Fraser McPhee
@FarmerFrase
So the dollars we spend to adopt 4R practices and use enhanced
efficiency fertilizers each year will not reduce our GHG emissions reported in the NIR unless we buy less, which is the Rate R
Fraser McPhee
@FarmerFrase
Fraser McPhee
@FarmerFrase
4.5.2. Methodological Issues, 2019 NIR p101:
Fraser McPhee
@FarmerFrase
4.5.2. Methodological Issues, 2019 NIR p101:
Ratio of Urea C density vs CO2 Emission reduction from CO2 stored in urea Urea production
Fraser McPhee
@FarmerFrase
2019 NIR – Part 2, page 233
Fraser McPhee
@FarmerFrase
2019 NIR – Part 1, page 7, table ES-2
Fraser McPhee
@FarmerFrase
Fraser McPhee
@FarmerFrase
2019 NIR – Part 2, page 12, table A2-1