
SLIDE 1
In-depth cholera epidemiological study of Cholera in Zimbabwe - - PowerPoint PPT Presentation
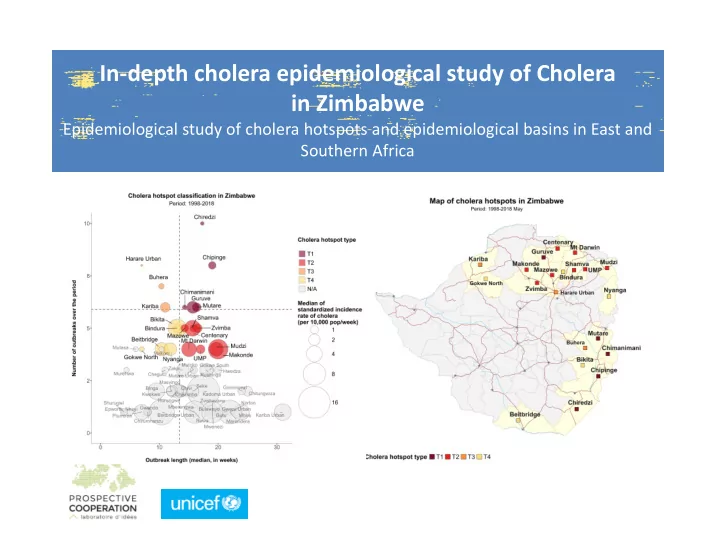
In-depth cholera epidemiological study of Cholera in Zimbabwe Epidemiological study of cholera hotspots and epidemiological basins in East and Southern Africa Prospective Cooperation Cholera Team Cholera specialist Bio-statistic specialist
2
3
4
5
7
8
9
10
11
12
Type Interpretatio n Frequency (Percentile
distribution) Frequency
Duration (Percentile
distribution ) Duration (number
weeks) Intensity (Percentile
distribution ) Intensity Median Indicende
time
PROVINCE DISTRICT POP Masvingo Chiredzi 292305 Manicaland Chipinge 316771 Manicaland Mutare 277851 Mashonaland Central Guruve 131483 Manicaland Chimanimani 143036 Mashonaland West Zvimba 278801 Mashonaland Central Centenary 130158 Mashonaland Central Shamva 131069 Mashonaland Central Mazowe 247457 Mashonaland West Makonde 162752 Mashonaland East Mudzi 141247 Mashonaland East UMP 119368 Mashonaland Central Mt Darwin 225489 Harare Harare Urban 1574345 Manicaland Buhera 260631 Mashonaland West Kariba 43851 Masvingo Bikita 172097 Mashonaland Central Bindura 132732 Manicaland Nyanga 134195 Matabeleland South Beitbridge 84888 Midlands Gokwe North 254773 CASES PROP 5283 4,5 5655 4,8 4398 3,7 1718 1,5 1646 1,4 2238 1,9 1038 0,9 2348 2 684 0,6 7398 6,3 3692 3,1 771 0,7 5602 4,7 16229 13,8 4242 3,6 1564 1,3 3111 2,6 2544 2,2 1158 1 5527 4,7 3039 2,6 DEATHS 194 150 321 66 117 130 43 65 29 209 275 69 180 502 164 51 205 52 95 159 148 FREQ 10 8 6 6 6 5 5 5 5 4 4 4 4 8 7 6 5 5 4 4 4 DUR 17,3 19,0 16,4 15,7 14,3 16,5 15,9 15,7 14,3 20,0 19,7 17,0 15,1 7,0 10,4 11,0 13,2 13,1 11,9 10,4 7,0 INT 0,19 0,87 1,16 2,28 0,29 1,22 0,77 4,01 0,86 6,15 3,05 1,21 3,51 0,05 0,45 1,44 1,36 5,28 2,53 2,74 0,36 HOTSPOT T.1 T.1 T.1 T.1 T.1 T.2 T.2 T.2 T.2 T.2 T.2 T.2 T.2 T.3 T.3 T.3 T.4 T.4 T.4 T.4 T.4
2,000,000 4,000,000 6,000,000 8,000,000 10,000,000 12,000,000 14,000,000 16,000,000
22
23
24
25
26
27