
SLIDE 1
In-depth cholera epidemiological study for South Sudan - - PowerPoint PPT Presentation
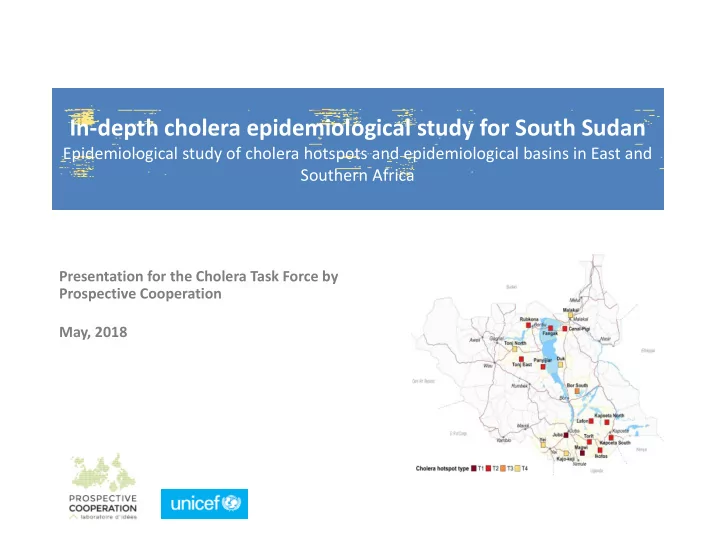
In-depth cholera epidemiological study for South Sudan Epidemiological study of cholera hotspots and epidemiological basins in East and Southern Africa Presentation for the Cholera Task Force by Prospective Cooperation May, 2018 Prospective
2
3
4
5
6
7
8
9
10
11
12
13
14
17
18
19
20
21