
SLIDE 1
Implications for State Urban & Community Forestry Programs: - - PowerPoint PPT Presentation
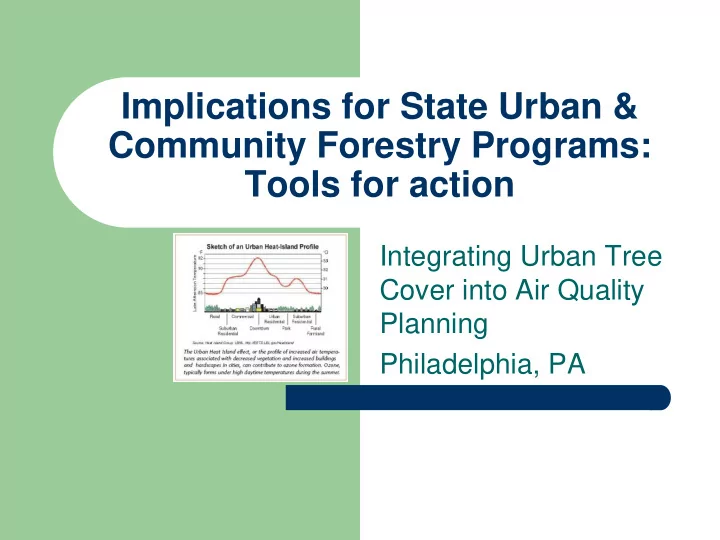
Implications for State Urban & Community Forestry Programs: Tools for action Integrating Urban Tree Cover into Air Quality Planning Philadelphia, PA April 22, 2004 Robert L. Ehrlich, Jr. C. Ronald Franks Governor Secretary Michael S.
Where is there opportunity?
– Existing and projected land use
30 m resolution
Nowak ArcView extension
Solar angle not optimal
Land area as a % of total area: 100% Water area as a % of total area: 0% tree canopy as a % of total area: 21% tree canopy as a % of land cover: 21% tree canopy as a % of vegetation: 33%
42%
42%
67% total veg as a % of total area: 62% total veg as a % of land cover: 62% impervious as a % of total area: 38% impervious as a % of land cover: 38% Land area as a % of total area: 100% Water area as a % of total area: 0% tree canopy as a % of total area: 33% tree canopy as a % of land cover: 33% tree canopy as a % of vegetation: 41%
46%
47%
59% total veg as a % of total area: 79% total veg as a % of land cover: 79% impervious as a % of total area: 21% impervious as a % of land cover: 21%
0% 20% 40% 60% 80% 100% % cover A C I R Zoning Category
Hagerstown Land Cover
Impervious Non-tree Veg Trees
R1 IG IR R2 C2 C3 A R3 C4 C5 R4 C1
83zone.shp 0.93 - 2.76 2.76 - 8.83 8.83 - 16.88 16.88 - 19.6 19.6 - 42.83
2 2 4 Miles
N E W S
Hagerstown % canopy cover by land use
R1 IG IR R2 C2 C3 A R3 C4 C5 R4 C1
83zone.shp
Mean 0 - 1 Std. Dev. 1 - 2 Std. Dev. 2 - 3 Std. Dev.
2 2 4 Miles
N E W S
Hagerstown-land use +/- mean % canopy
Nowak and Luley (2002)
– CRD indicates new canopy from the replacement of dead trees – CRH new canopy from the replacement of removed or lost
– CNS new canopy derived from new sites (i.e., the
– Nowak and Luley (2002)
Funded via grants to persons or jurisdictions of tree
Mitigation funds (pollution, construction, etc.) allowed to be
Audit; units maintained; $ spent on maintenance
Examples
– Forest Conservation (development) – Reforestation Law (highway construction) – Critical Area law (all trees w/in 1000’ of Ches. Bay waters) – Roadside Tree Law (all roadside trees)
Audit; units accomplished; $ spent on protection
Tree City USA, Tree Line USA, PLANT Community
Mitigation funds (pollution, construction, etc.) allowed to be
Events; attendees; seat hours; materials
Mitigation funds (pollution, construction, etc.) allowed to be
Press releases, articles, displays, etc.
Requires preservation of trees
Trees or acres removed or cleared
Afforestation Reforestation
Enactment, administration, and enforcement of ordinance
– # Trees/acres planted
Maintain base line level in spite of attrition
– Replacement planting
Enactment, administration, and enforcement of ordinance
– # Trees/acres planted
‘Grow not mow’ Designating areas for regeneration
– Ordinance or policy
Enactment, administration, and enforcement of ordinance
– # Acres protected/allowed to regenerate
Tree City USA, Tree Line USA, PLANT Community
Mitigation funds (pollution, construction, etc.) allowed to be
Events; attendees; seat hours; materials
Mitigation funds (pollution, construction, etc.) allowed to be
Press releases, articles, displays, etc.