SLIDE 1 Image Reconstruction with Predictive Filter Flow
Shu Kong, Charless Fowlkes
- Dept. of Computer Science, University of California, Irvine
{skong2, fowlkes}@ics.uci.edu [Project Page], [Github], [Slides], [Poster] Abstract
We propose a simple, interpretable framework for solv- ing a wide range of image reconstruction problems such as denoising and deconvolution. Given a corrupted input im- age, the model synthesizes a spatially varying linear filter which, when applied to the input image, reconstructs the desired output. The model parameters are learned using supervised or self-supervised training. We test this model
- n three tasks: non-uniform motion blur removal, lossy-
compression artifact reduction and single image super res-
- lution. We demonstrate that our model substantially out-
performs state-of-the-art methods on all these tasks and is significantly faster than optimization-based approaches to
- deconvolution. Unlike models that directly predict output
pixel values, the predicted filter flow is controllable and in- terpretable, which we demonstrate by visualizing the space
- f predicted filters for different tasks.1
- 1. Introduction
Real-world images are seldom perfect. Practical en- gineering trade-offs entail that consumer photos are often blurry due to low-light, camera shake or object motion, lim- ited in resolution and further degraded by image compres- sion artifacts introduced for the sake of affordable transmis- sion and storage. Scientific applications such as microscopy
- r astronomy, which push the fundamental physical limita-
tions of light, lenses and sensors, face similar challenges. Recovering high-quality images from degraded measure- ments has been a long-standing problem for image analysis and spans a range of tasks such as blind-image deblurring [4, 30, 13, 45], compression artifact reduction [46, 35], and single image super-resolution [41, 59]. Such image reconstruction tasks can be viewed mathe- matically as inverse problems [50, 22], which are typically
1 Due to that arxiv limits the size of files, we put high-resolution figures,
as well as a manuscript with them, in the project page.
ill-posed and massively under-constrained. Many contem- porary techniques to inverse problems have focused on reg- ularization techniques which are amenable to computational
- ptimization. While such approaches are interpretable as
Bayesian estimators with particular choice of priors, they are often computationally expensive in practice [13, 45, 2]. Alternately, data-driven methods based on training deep convolutional neural networks yield fast inference but lack interpretability and guarantees of robustness [48, 61]. In this paper, we propose a new framework called Predictive Filter Flow that retains interpretability and control over the resulting reconstruction while allowing fast inference. The proposed framework is directly applicable to a variety of low-level computer vision problems involving local pixel transformations. As the name suggests, our approach is built on the no- tion of filter flow introduced by Seitz and Baker [44]. In filter flow pixels in a local neighborhood of the input im- age are linearly combined to reconstruct the pixel centered at the same location in the output image. However, unlike convolution, the filter weights are allowed to vary from one spatial location to the next. Filter flows are a flexible class
- f image transformations that can model a wide range of
imaging effects (including optical flow, lighting changes, non-uniform blur, non-parametric distortion). The original work on filter flow [44] focused on the problem of estimat- ing an appropriately regularized/constrained flow between a given pair of images. This yielded convex but impractically large optimization problems (e.g., hours of computation to compute a single flow). Instead of solving for an optimal filter flow, we propose to directly predict a filter flow given an input image using a convolutional neural net (CNN) to regress the filter weights. Using a CNN to directly predict a well regularized solution is orders of magnitude faster than expensive iterative optimization.
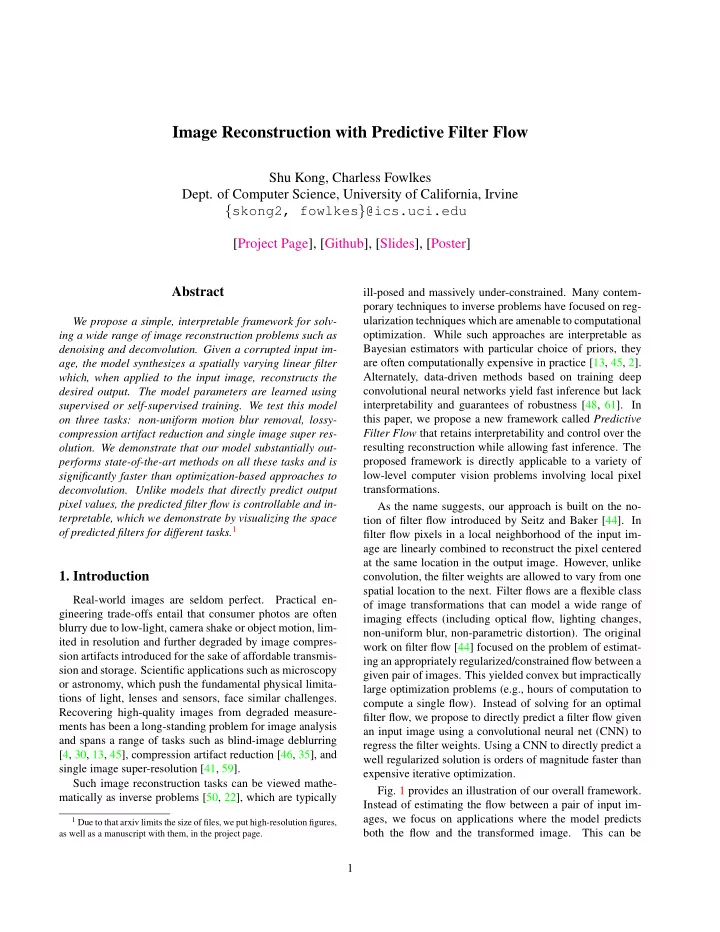
- Fig. 1 provides an illustration of our overall framework.
Instead of estimating the flow between a pair of input im- ages, we focus on applications where the model predicts both the flow and the transformed image. This can be 1
SLIDE 2 Figure 1: Overview of our proposed framework for Predictive Filter Flow which is readily applicable to various low-level vision prob-
lems, yielding state-of-the-art performance for non-uniform motion blur removal, compression artifact reduction and single image super-
- resolution. Given a corrupted input image, a two-stream CNN analyzes the image and synthesizes the weights of a spatially-varying linear
- filter. This filter is then applied to the input to produce a deblurred/denoised prediction. The whole framework is end-to-end trainable in
a self-supervised way for tasks such as super-resolution where corrupted images can be generated automatically. The predicted filters are easily constrained for different tasks and interpretable (here visualized in the center column by the mean flow displacement, see Fig. 6).
viewed as “blind” filter flow estimation, in analogy with blind deconvolution. During training, we use a loss defined
- ver the transformed image (rather than the predicted flow).
This is closely related to so-called self-supervised tech- niques that learn to predict optical flow and depth from un- labeled video data [15, 16, 21]. Specifically, for the recon- struction tasks we consider such as image super-resolution, the forward degradation process can be easily simulated to generate a large quantity of training data without manual collection or annotation. The lack of interpretability in deep image-to-image re- gression models makes it hard to provide guarantees of ro- bustness in the presence of adversarial input [31], and con- fer reliability needed for researchers in biology and medical science [36]. Predictive filter flow differs from other CNN- based approaches in this regard since the intermediate filter flows are interpretable and transparent [52, 12, 34], provid- ing an explicit description of how the input is transformed into output. It is also straightforward to inject constraints
- n the reconstruction (e.g., local brightness conservation)
which would be nearly impossible to guarantee for deep image-to-image regression models. To evaluate our model, we carry out extensive experi- ments on three different low-level vision tasks, non-uniform motion blur removal, JPEG compression artifact reduction and single image super-resolution. We show that our model surpasses all the state-of-the-art methods on all the three
- tasks. We also visualize the predicted filters which reveals
filtering operators reminiscent of classic unsharp masking filters and anisotropic diffusion along boundaries. To summarize our contribution: (1) we propose a novel, end-to-end trainable, learning framework for solving vari-
- us low-level image reconstruction tasks; (2) we show this
framework is highly interpretable and controllable, enabling direct post-hoc analysis of how the reconstructed image is generated from the degraded input; (3) we show experimen- tally that predictive filter flow outperforms the state-of-the- art methods remarkably on the three different tasks, non- uniform motion blur removal, compression artifact reduc- tion and single image super-resolution.
Our work is inspired by filter flow [44], which is an op- timization based method for finding a linear transformation relating nearby pixel values in a pair of images. By im- posing additional constraints on certain structural properties
- f these filters, it serves as a general framework for under-
standing a wide variety of low-level vision problems. How- ever, filter flow as originally formulated has some obvious
- shortcomings. First, it requires prior knowledge to specify
a set of constraints needed to produce good results. It is not always straightforward to model or even come up with such knowledge-based constraints. Second, solving for an opti- mal filter flow is compute intensive; it may take up to 20 hours to compute over a pair of 500×500 images [44]. We address these by directly predicting flows from image data. We leverage predictive filter flow for targeting three specific image reconstruction tasks which can be framed as perform- ing spatially variant filtering over local image patches. Non-Uniform Blind Motion Blur Removal is an ex-
SLIDE 3 tremely challenging yet practically significant task of re- moving blur caused by object motion or camera shake on a blurry photo. The blur kernel is unknown and may vary
- ver the image. Recent methods estimate blur kernels lo-
cally at patch level, and adopt an optimization method for deblurring the patches [48, 2]. [55, 18, 48] leverage prior in- formation about smooth motion by selecting from a prede- fine discretized set of linear blur kernels. These methods are computationally expensive as an iterative solver is required for deconvolution after estimating the blur kernel [9]; and the deep learning approach cannot generalize well to novel motion kernels [56, 48, 18, 43]. Compression Artifact Reduction is of significance as lossy image compression is ubiquitous for reducing the size of images transmitted over the web and recorded on data storage media. However, high compression rates come with visual artifacts that degrade the image quality and thus user experience. Among various compression algorithms, JPEG has become the most widely accepted standard in lossy image compression with several (non- invertible) transforms [53], i.e., downsampling and DCT
- quantization. Removing artifacts from jpeg compression
can be viewed as a practical variant of natural image de- noising problems [6, 20]. Recent methods based on deep convolutional neural networks trained to take as input the compressed image and output the denoised image directly achieve good performance [10, 49, 7]. Single Image Super-Resolution aims at recovering a high- resolution image from a single low-resolution image. This problem is inherently ill-posed as a multiplicity of solu- tions exists for any given low-resolution input. Many meth-
- ds adopt an example-based strategy [58] requiring an op-
timization solver, others are based on deep convolutional neural nets [11, 32] which achieve the state-of-the-art and real-time performance. The deep learning methods take as input the low-resolution image (usually 4× upsampled one using bicubic interpolation), and output the high-resolution image directly.
- 3. Predictive Filter Flow
Filter flow models image transformations I1 → I2 as a linear mapping where each output pixel only depends on a local neighborhood of the input. Find such a flow can be framed as solving a constrained linear system I2 = TI1, T ∈ Γ. (1) where T is a matrix whose rows act separately on a vec- torized version of the source image I1. For the model 1 to make sense, T ∈ Γ must serve as a placeholder for the entire set of additional constraints on the operator which enables a unique solution that satisfies our expectations for particular problems of interest. For example, standard con- volution corresponds to T being a circulant matrix whose rows are cyclic permutations of a single set of filter weights which are typically constrained to have compact localized non-zero support. For a theoretical perspective, Filter Flow model 1 is simple and elegant, but directly solving Eq. 1 is intractable for image sizes we typically encounter in prac- tice, particularly when the filters are allowed to vary spa- tially.
3.1. Learning to predict flows
Instead of optimizing over T directly, we seek for a learnable function fw(·) parameterized by w that predicts the transformation ˆ T specific to image I1 taken as input: I2 ≈ ˆ TI1, ˆ T ≡ fw(I1), (2) We call this model Predictive Filter Flow. Manually design- ing such a function fw(·) isn’t feasible in general, therefore we learn a specific fw under the assumption that I1, I2 are drawn from some fixed joint distribution. Given sampled image pairs, {(Ii
1, Ii 2)}, where i
= 1, . . . , N, we seek parameters w that minimize the differ- ence between a recovered image ˆ I2 and the real one I2 mea- sured by some loss ℓ. min
w N
ℓ(Ii
2 − fw(Ii 1) · Ii 1) + R(fw(Ii 1)),
s.t. constraint on w (3) Note that constraints on w are different from constraints Γ used in Filter Flow. In practice, we enforce hard constraints via our choice of the architecture/functional form of f along with soft-constraints via additional regularization term R. We also adopt commonly used L2 regularization on w to reduce overfitting. There are a range of possible choices for measuring the difference between two images. In our experiments, we simply use the robust L1 norm to measure the pixel-level difference. Filter locality In principle, each pixel output I2 in Eq. 3 can depend on all input pixels I2. We introduce the struc- tural constraint that each output pixel only depends on a corresponding local neighborhood of the input. The size of this neighborhood is thus a hyper-parameter of the model. We note that while the predicted filter flow ˆ T acts locally, the estimation of the correct local flow within a patch can depend on global context captured by large receptive fields in the predictor fw(·). In practice, this constraint is implemented by using the “im2col” operation to vectorize the local neighborhood patch centered at each pixel and compute the inner prod- uct of this vector with the corresponding predicted filter. This operation is highly optimized for available hardware architectures in most deep learning libraries and has time
SLIDE 4 and space cost similar to computing a single convolution. For example, if the filter size is 20×20, the last layer of the CNN model fw(·) outputs a three-dimensional array with a channel dimension of 400, which is comparable to fea- ture activations at a single layer of typical CNN architec- tures [29, 47, 17]. Other filter constraints Various priori constraints on the filter flow ˆ T ≡ fw(I1) can be added easily to enable better model training. For example, if smoothness is desired, an L2 regularization on the (1st order or 2nd order) derivative
- f the filter flow maps can be inserted during training; if
sparsity is desired, an L1 regularization on the filter flows can be added easily. In our work, we add sum-to-one and non-negative constraints on the filters for the task of non- uniform motion blur removal, meaning that the values in each filter should be non-negative and sum-to-one by as- suming there is no lighting change. This can be easily done by inserting a softmax transform across channels of the pre- dicted filter weights. For other tasks, we simply let the model output free-form filters with no further constraints
Self-Supervision Though the proposed framework for training Predictive Filter Flow requires paired inputs and target outputs, we note that generating training data for many reconstruction tasks can be accomplished automati- cally without manual labeling. Given a pool of high qual- ity images, we can automatically generate low-resolution, blurred or JPEG degraded counterparts to use in training (see Section 4). This can also be generalized to so-called self-supervised training for predicting flows between video frames or stereo pairs.
3.2. Model Architecture and Training
Our basic framework is largely agnostic to the choice
- f architectures, learning method, and loss functions. In
- ur experiments, we utilize to a two-stream architecture as
shown in Fig. 1. The first stream is a simple 18-layer net- work with 3×3 convolutional layers, skip connections [17], pooling layers and upsampling layers; the second stream is a shallow but full-resolution network with no pooling. The first stream has larger receptive fields for estimating per-pixel filters by considering long-range contextual infor- mation, while the second stream keeps original resolution as input image without inducing spatial information loss. Batch normalization [19] is also inserted between a con- volution layer and ReLU layer [40]. The Predictive Fil- ter Flow is self-supervised so we could generate an unlim- ited amount of image pairs for training very large models. However, we find a light-weight architecture trained over moderate-scale training set performs quite well. Since our architecture is different from other feed-forward image-to- image regression CNNs, we also report the baseline per- formance of the two-stream architecture trained to directly predict the reconstructed image rather than the filter coeffi- cients. For training, we crop 64×64-resolution patches to form a batch of size 56. Since the model adapts to patch bound- ary effects seen during training, at test time we apply it to non-overlapping tiles of the input image. However, we note that the model is fully convolutional so it could be trained
- ver larger patches to avoid boundary effects and applied to
arbitrary size inputs. We use ADAM optimization method during train- ing [24], with initial learning 0.0005 and coefficients 0.9 and 0.999 for computing running averages of gradient and its square. As for the training loss, we simply use the ℓ1-norm loss measuring absolute difference over pixel in- tensities. We train our model from scratch on a single NVIDIA TITAN X GPU, and terminate after several hun- dred epochs2.
We evaluate the proposed Predictive Filter Flow frame- work (PFF) on three low-level vision tasks: non-uniform motion blur removal, JPEG compression artifact reduction and single image super-resolution. We first describe the datasets and evaluation metrics, and then compare with state-of-the-art methods on the three tasks in separate sub- sections, respectively.
4.1. Datasets and Metrics
We use the high-resolution images in DIV2K dataset [1] and BSDS500 training set [39] for training all our models
- n the three tasks. This results into a total of 1,200 train-
ing images. We evaluate each model over different datasets specific to the task. Concretely, we test our model for non- uniform motion blur removal over the dataset introduced in [2], which contains large motion blur up to 38 pixels. We evaluate over the classic LIVE1 dataset [54] for JPEG com- pression artifacts reduction, and Set5 [5] and Set14 [60] for single image super-resolution. To quantitatively measure performance, we use Peak- Signal-to-Noise-Ratio (PSNR) and Structural Similarity In- dex (SSIM) [54] over the Y channel in YCbCr color space between the output quality image and the original image. This is a standard practice in literature for quantitatively measuring the recovered image quality.
SLIDE 5 Figure 2: Visual comparison of our method (PFF) to CNN [Sun, et al.] [48] and patch-optim [Bahat, et al.] [2] on testing images released by [2]. Please be guided with the strong edges in the filter flow maps to compare visual details in the deblurred images by different methods. Also note that the bottom two rows display images from the real-world, meaning they are not synthesized and there is no blur ground-truth for them. Best view in color and zoom-in. Table 1: Comparison on motion blur removal over the non- uniform motion blur dataset [2]. For the two metrics, the larger value means better performance of the model.
Moderate Blur metric [57] [48] [2] CNN PFF PSNR 22.88 24.14 24.87 24.51 25.39 SSIM 0.68 0.714 0.743 0.725 0.786 Large Blur metric [57] [48] [2] CNN PFF PSNR 20.47 20.84 22.01 21.06 22.30 SSIM 0.54 0.56 0.624 0.560 0.638
4.2. Non-Uniform Motion Blur Removal
To train models for non-uniform motion blur removal, we generate the 64×64-resolution blurry patches from clear
- nes using random linear kernels [48], which are of size
30×30 and have motion vector with random orientation in [0, 180◦] degrees and random length in [1, 30] pixels. We set the predicted filter size to be 17×17 so the model outputs 17×17=289 filter weights at each image location. Note that we generate training pairs on the fly during training, so our model can deal with a wide range of motion blurs. This is advantageous over methods in [48, 2] which require a pre- defined set of blur kernels used for deconvolution through some offline algorithm.
2Models with early termination (∼2 hours for dozens of epochs) still
achieve very good performance, but top performance appears after 1–2 days training. The code and models can be found in https://github. com/aimerykong/predictive-filter-flow
SLIDE 6 In Table 1, we list the comparison with the state-of-the- art methods over the released test set by [2]. There are two subsets in the dataset, one with moderate motion blur and the other with large blur. We also report our CNN mod- els based on the proposed two-stream architecture that out- puts the quality images directly by taking as input the blurry
- nes. Our CNN model outperforms the one in [48] which
trains a CNN for predicting the blur kernel over a patch, but carries out non-blind deconvolution with the estimated kernel for the final quality image. We attribute our better performance to two reasons. First, our CNN model learns a direct inverse mapping from blurry patch to its clear coun- terpart based on the learned image distribution, whereas [48] only estimates the blur kernel for the patch and uses an offline optimization for non-blind deblurring, resulting in some artifacts such as ringing. Second, our CNN archi- tecture is higher fidelity than the one used in [48], as ours
- utputs full-resolution result and learns internally to mini-
mize artifacts, e.g., aliasing and ringing effect. From the table, we can see our PFF model outperforms all the other methods by a fair margin. To understand where
- ur model performs better, we visualize the qualitative re-
sults in Fig. 2, along with the filter flow maps as output from
- PFF. We can’t easily visualize the 289 dimensional filters.
However, since the predicted weights ˆ T are positive and L1 normalized, we can treat them as a distribution which we summarize by computing the expected flow vector vx(i, j) vy(i, j)
ˆ Tij,xy x − i y − j
- where ij is a particular output pixel and xy indexes the input
- pixels. This can be interpreted as the optical flow (delta
filter) which most closely approximates the predicted filter
- flow. We use the the color legend shown in top-left of Fig. 6.
The last two rows of Fig. 2 show the results over real-world blurry images for which there is no “blur-free” ground-truth. We can clearly see that images produced by PFF have less artifacts such as ringing artifacts around sharp edges [48, 2]. Interestingly, from the filter flow maps, we can see that the expected flow vectors are large near high contrast boundaries and smaller in regions that are already in sharp focus or which are uniform in color. Although we define the filter size as 17×17, which is much smaller than the maximum shift in the largest blur (up to 30 pixels), our model still handles large motion blur and performs better than [2]. We assume it should be possible to utilize larger filter sizes but we did not observe further im- provements when training models to synthesize larger per- pixel kernels. This suggests that a larger blurry dataset is needed to validate this point in future work. We also considered an iterative variant of our model in which we feed the resulting deblurred image back as in- put to the model. However, we found relatively little im- Figure 3: Visual comparison of our methods (PFF and CNN). Strong edges in the expected flow map (right) high- light areas where most apparent artifacts are removed. More results can be found in the appendix. Best viewed in color and zoomed-in. Table 2: Comparison on JPEG compression artifact reduc- tion over LIVE1 dataset [54]. PSNR and SSIM are used as metrics listed on two rows respectively in each macro row grid (the larger the better).
QF JPEG SA-DCT AR-CNN L4 CAS-CNN MWCNN PFF [14] [10] [49] [7] [37] 10 27.77 28.65 29.13 29.08 29.44 29.69 29.82 0.791 0.809 0.823 0.824 0.833 0.825 0.836 20 30.07 30.81 31.40 31.42 31.70 32.04 32.14 0.868 0.878 0.890 0.890 0.895 0.889 0.905 40 32.35 32.99 33.63 33.77 34.10 34.45 34.67 0.917 0.940 0.931 — 0.937 0.930 0.949
provement with additional iterations (results shown in the appendix). We conjecture that, although the model was trained with a wide range of blurred examples, the statistics
- f the transformed image from the first iteration are suffi-
ciently different than the blurred training inputs. One so- lution could be inserting adversarial loss to push the model to generate more fine-grained textures (as done in [32] for image super-resolution).
4.3. JPEG Compression Artifact Reduction
Similar to training for image deblurring, we gener- ate JPEG compressed image patches from original non- compressed ones on the fly during training. This can be easily done using JPEG compression function by varying the quality factor (QF) of interest. In Table 2, we list the performance of our model and compare to the state-of-the-art methods. We note that our final PFF achieves the best among all the methods. Our CNN baseline model also achieves on-par performance with state-of-the-art, though we do not show in the table, we draw the performance under the ablation study in Fig. 4.
SLIDE 7 PSNR improvements. SSIM improvements. Figure 4: Performance vs. training data with different com- pression quality factors measured by PSNR and SSIM and their performance gains, over the LIVE1 dataset. The orig- inal JPEG compression is plotted for baseline. Specifically, we study how our model trained with single
- r a mixed QFs affect the performance when tested on im-
age compressed with a range of different QFs. We plot the detailed performances of our CNN and PFF in terms of ab- solute measurements by PSNR and SSIM, and the increase in PSNR between the reconstructed and JPEG compressed image. We can see that, though a model trained with QF=10
- verfits the dataset, all the other models achieve general-
izable and stable performance. Basically, a model trained
- n a single QF brings the largest performance gain over im-
ages compressed with the same QF. Moreover, when our model is trained with mixed quality factors, its performance is quite stable and competitive with quality-specific models across different compression quality factors. This indicates that our model is of practical value in real-world applica- tions. In Fig. 3, we demonstrate qualitative comparison be- tween CNN and PFF. The output filter flow maps indicate from the colorful edges how the pixels are warped from the neighborhood in the input image. This also clearly shows where the JPEG image degrades most, e.g., the large sky region is quantized by JPEG compression. Though CNN makes the block effect smooth to some extent, our PFF pro- duces the best visual quality, smoothing the block artifact while maintaining both high- and low-frequency details. Figure 5: Visual comparison of our method (PFF) to CNN, each image is super-resolved (×4). More results can be found in the appendix. Best view in color and zoom-in. Table 3: Comparison on single image super-resolution (×4)
- ver the classic Set5 [5] and Set14 [60] datasets. The met-
rics used here are PSNR (dB) and SSIM listed as two rows, respectively.
Bicubic NE+LLE KK A+ SRCNN RDN+ PFF [8] [23] [51] [11] [61]
Set5
28.42 29.61 29.69 30.28 30.49 32.61 32.74 0.8104 0.8402 0.8419 0.8603 0.8628 0.9003 0.9021
Set14
26.00 26.81 26.85 27.32 27.50 28.92 28.98 0.7019 0.7331 0.7352 0.7491 0.7513 0.7893 0.7904
4.4. Single Image Super-Resolution
In this work, we only generate pairs to super-resolve im- ages 4× larger. To generate training pairs, for each orig- inal image, we downsample 1
4× and upsample 4× again
using bicubic interpolation (with anti-aliasing). The 4× up- sampled image from the low-resolution is the input to our
- model. Therefore, a super-resolution model is expected to
be learned for sharpening the input image. In Table 3, we compare our PFF model quantitatively with other methods. We can see that our model outperforms the others on both test sets. In Fig. 5, we compare visually
- ver bicubic interpolation, CNN and PFF. We can see from
the zoom-in regions that our PFF generates sharper bound- aries and delivers an anti-aliasing functionality. The filter flow maps once again act as a guide, illustrating where the smoothing happens and where sharpening happens. Espe- cially, the filter maps demonstrate from the strong colorful edges where the pixels undergo larger transforms. In next section, we visualize the per-pixel kernels to have an in- depth understanding.
SLIDE 8 Figure 6: Three row-wise panels: (1) We run K-means (K=400) on all filters synthesized by the model over the test set, and visualize the 400 centroid kernels using t-SNE on a 2D plane; (2) top ten principal components of the synthesized filters; (3) visualizing the color coded filter flow along with input and quality image. Each pixels filter is assigned to the nearest centroid and the color for the centroid is based on the 2D t-SNE embedding using the color chart shown at top left.
- 5. Visualization and Analysis
We explored a number of techniques to visualize the pre- dicted filter flows for different tasks. First, we ran k-means
- n predicted filters from the set of test images for each the
three tasks, respectively, to cluster the kernels into K=400
- groups. Then we run t-SNE [38] over the 400 mean filters to
display them in the image plane, shown by the scatter plots in top row of Fig. 6. Qualitative inspection shows filters that can be interpreted as performing translation or integra- tion along lines of different orientation (non-uniform blur), filling in high-frequency detail (jpeg artifact reduction) and deformed Laplacian-like filters (super-resolution). We also examined the top 10 principal components of the predicted filters (shown in the second row grid in Fig. 6). The 10D principal subspace capture 99.65%, 99.99% and 99.99% of the filter energy for non-uniform blur, artifact removal and super resolution respectively. PCA reveals smooth, symmetric harmonic structure for super-resolution with some intriguing vertical and horizontal features. Finally, in order to summarize the spatially varying structure of the filters, we use the 2D t-SNE embedding to assign a color to each centroid (as given by the reference color chart shown top-left), and visualize the nearest cen- troid for the filter at each filter location in the third row grid in Fig. 6. This visualization demonstrates the filters as out- put by our model generally vary smoothly over the image with discontinuities along salient edges and textured regions reminiscent of anisotropic diffusion or bilateral filtering. In summary, these visualizations provide a transparent view of how each reconstructed pixel is assembled from the degraded input image. We view this as a notable advan- tage over other CNN-based models which simply perform image-to-image regression. Unlike activations of interme-
SLIDE 9 diate layers of a CNN, linear filter weights have a well de- fined semantics that can be visualized and analyzed using well developed tools of linear signal processing.
- 6. Conclusion and Future Work
We propose a general, elegant and simple framework called Predictive Filter Flow, which has direct applications to a broad range of image reconstruction tasks. Our frame- work generates space-variant per-pixel filters which are easy to interpret and fast to compute at test time. Through extensive experiments over three different low-level vision tasks, we demonstrate this approach outperforms the state-
In our experiments here, we only train light-weight mod- els over patches, However, we believe global image context is also important for these tasks and is an obvious direction for future work. For example, the global blur structure con- veys information about camera shake; super-resolution and compression reduction can benefit from long-range interac- tions to reconstruct high-frequency detail (as in non-local means). Moreover, we expect that the interpretability of the
- utput will be particularly appealing for interactive and sci-
entific applications such as medical imaging and biological microscopy where predicted filters could be directly com- pared to physical models of the imaging process.
Acknowledgement
This project is supported by NSF grants IIS-1618806, IIS-1253538, DBI-1262547 and a hardware donation from NVIDIA.
References
[1] E. Agustsson and R. Timofte. Ntire 2017 challenge on sin- gle image super-resolution: Dataset and study. In The IEEE Conference on Computer Vision and Pattern Recognition (CVPR) Workshops, July 2017. 4 [2] Y. Bahat, N. Efrat, and M. Irani. Non-uniform blind deblur- ring by reblurring. In Proceedings of the IEEE Conference
- n Computer Vision and Pattern Recognition, pages 3286–
3294, 2017. 1, 3, 4, 5, 6, 13, 14 [3] V. Belagiannis and A. Zisserman. Recurrent human pose es-
- timation. In 2017 12th IEEE International Conference on
Automatic Face & Gesture Recognition (FG 2017), pages 468–475. IEEE, 2017. 12 [4] A. J. Bell and T. J. Sejnowski. An information-maximization approach to blind separation and blind deconvolution. Neu- ral computation, 7(6):1129–1159, 1995. 1 [5] M. Bevilacqua, A. Roumy, C. Guillemot, and M. L. Alberi-
- Morel. Low-complexity single-image super-resolution based
- n nonnegative neighbor embedding. In British Machine Vi-
sion Conference, 2012. 4, 7 [6] A. Buades, B. Coll, and J.-M. Morel. A non-local algorithm for image denoising. In Computer Vision and Pattern Recog- nition, 2005. CVPR 2005. IEEE Computer Society Confer- ence on, volume 2, pages 60–65. IEEE, 2005. 3 [7] L. Cavigelli, P. Hager, and L. Benini. Cas-cnn: A deep convolutional neural network for image compression artifact suppression. In Neural Networks (IJCNN), 2017 Interna- tional Joint Conference on, pages 752–759. IEEE, 2017. 3, 6 [8] H. Chang, D.-Y. Yeung, and Y. Xiong. Super-resolution through neighbor embedding. In Computer Vision and Pat- tern Recognition, 2004. CVPR 2004. Proceedings of the 2004 IEEE Computer Society Conference on, volume 1, pages I–I. IEEE, 2004. 7 [9] S. Cho, J. Wang, and S. Lee. Handling outliers in non-blind image deconvolution. In Computer Vision (ICCV), 2011 IEEE International Conference on, pages 495–502. IEEE,
[10] C. Dong, Y. Deng, C. Change Loy, and X. Tang. Compres- sion artifacts reduction by a deep convolutional network. In Proceedings of the IEEE International Conference on Com- puter Vision, pages 576–584, 2015. 3, 6 [11] C. Dong, C. C. Loy, K. He, and X. Tang. Image super-resolution using deep convolutional networks. IEEE transactions on pattern analysis and machine intelligence, 38(2):295–307, 2016. 3, 7 [12] F. Doshi-Velez and B. Kim. Towards a rigorous sci- ence of interpretable machine learning. arXiv preprint arXiv:1702.08608, 2017. 2 [13] R. Fergus, B. Singh, A. Hertzmann, S. T. Roweis, and W. T.
- Freeman. Removing camera shake from a single photograph.
In ACM transactions on graphics (TOG), volume 25, pages 787–794. ACM, 2006. 1 [14] A. Foi, V. Katkovnik, and K. Egiazarian. Pointwise shape- adaptive dct for high-quality denoising and deblocking of grayscale and color images. IEEE Transactions on Image Processing, 16(5):1395–1411, 2007. 6 [15] R. Garg, V. K. BG, G. Carneiro, and I. Reid. Unsupervised cnn for single view depth estimation: Geometry to the res- cue. In European Conference on Computer Vision, pages 740–756. Springer, 2016. 2 [16] C. Godard, O. Mac Aodha, and G. J. Brostow. Unsupervised monocular depth estimation with left-right consistency. In CVPR, volume 2, page 7, 2017. 2 [17] K. He, X. Zhang, S. Ren, and J. Sun. Deep residual learn- ing for image recognition. In Proceedings of the IEEE con- ference on computer vision and pattern recognition, pages 770–778, 2016. 4 [18] M. Hradiˇ s, J. Kotera, P. Zemc´ ık, and F. ˇ
tional neural networks for direct text deblurring. In Proceed- ings of BMVC, volume 10, page 2, 2015. 3 [19] S. Ioffe and C. Szegedy. Batch normalization: Accelerating deep network training by reducing internal covariate shift. arXiv preprint arXiv:1502.03167, 2015. 4 [20] V. Jain and S. Seung. Natural image denoising with convo- lutional networks. In Advances in Neural Information Pro- cessing Systems, pages 769–776, 2009. 3 [21] J. Y. Jason, A. W. Harley, and K. G. Derpanis. Back to ba- sics: Unsupervised learning of optical flow via brightness
SLIDE 10 constancy and motion smoothness. In European Conference
- n Computer Vision, pages 3–10. Springer, 2016. 2
[22] J. Kaipio and E. Somersalo. Statistical and computational inverse problems, volume 160. Springer Science & Business Media, 2006. 1 [23] K. I. Kim and Y. Kwon. Single-image super-resolution using sparse regression and natural image prior. IEEE transactions
- n pattern analysis & machine intelligence, (6):1127–1133,
- 2010. 7
[24] D. P. Kingma and J. Ba. Adam: A method for stochastic
- ptimization. arXiv preprint arXiv:1412.6980, 2014. 4
[25] S. Kong and C. Fowlkes. Low-rank bilinear pooling for fine- grained classification. In Proceedings of the IEEE Confer- ence on Computer Vision and Pattern Recognition (CVPR), pages 7025–7034. IEEE, 2017. 12 [26] S. Kong and C. Fowlkes. Recurrent pixel embedding for instance grouping. In Proceedings of the IEEE Conference
- n Computer Vision and Pattern Recognition (CVPR), pages
9018–9028, 2018. 12 [27] S. Kong and C. Fowlkes. Recurrent scene parsing with per- spective understanding in the loop. In Proceedings of the IEEE Conference on Computer Vision and Pattern Recogni- tion (CVPR), 2018. 12 [28] S. Kong, X. Shen, Z. Lin, R. Mech, and C. Fowlkes. Photo aesthetics ranking network with attributes and con- tent adaptation. In European Conference on Computer Vision (ECCV), pages 662–679. Springer, 2016. 12 [29] A. Krizhevsky, I. Sutskever, and G. E. Hinton. Imagenet classification with deep convolutional neural networks. In Advances in neural information processing systems, pages 1097–1105, 2012. 4 [30] D. Kundur and D. Hatzinakos. Blind image deconvolution. IEEE signal processing magazine, 13(3):43–64, 1996. 1 [31] A. Kurakin, I. Goodfellow, and S. Bengio. Adversarial exam- ples in the physical world. arXiv preprint arXiv:1607.02533,
[32] C. Ledig, L. Theis, F. Husz´ ar, J. Caballero, A. Cunningham,
- A. Acosta, A. P. Aitken, A. Tejani, J. Totz, Z. Wang, et al.
Photo-realistic single image super-resolution using a genera- tive adversarial network. In CVPR, volume 2, page 4, 2017. 3, 6, 12 [33] K. Li, B. Hariharan, and J. Malik. Iterative instance segmen-
- tation. In Proceedings of the IEEE Conference on Computer
Vision and Pattern Recognition, 2016. 12 [34] Z. C. Lipton. The mythos of model interpretability. Commun. ACM, 61(10):36–43, 2018. 2 [35] P. List, A. Joch, J. Lainema, G. Bjontegaard, and M. Kar-
- czewicz. Adaptive deblocking filter. IEEE transactions on
circuits and systems for video technology, 13(7):614–619,
[36] G. Litjens, T. Kooi, B. E. Bejnordi, A. A. A. Setio, F. Ciompi,
- M. Ghafoorian, J. A. van der Laak, B. Van Ginneken, and
- C. I. S´
- anchez. A survey on deep learning in medical image
- analysis. Medical image analysis, 42:60–88, 2017. 2
[37] P. Liu, H. Zhang, K. Zhang, L. Lin, and W. Zuo. Multi-level wavelet-cnn for image restoration. In The IEEE Conference
- n Computer Vision and Pattern Recognition (CVPR), 2018.
6 [38] L. v. d. Maaten and G. Hinton. Visualizing data using t-sne. Journal of machine learning research, 9(Nov):2579–2605,
[39] D. Martin, C. Fowlkes, D. Tal, and J. Malik. A database of human segmented natural images and its application to eval- uating segmentation algorithms and measuring ecological
- statistics. In Computer Vision, 2001. ICCV 2001. Proceed-
- ings. Eighth IEEE International Conference on, volume 2,
pages 416–423. IEEE, 2001. 4 [40] V. Nair and G. E. Hinton. Rectified linear units improve restricted boltzmann machines. In Proceedings of the 27th international conference on machine learning (ICML-10), pages 807–814, 2010. 4 [41] S. C. Park, M. K. Park, and M. G. Kang. Super-resolution image reconstruction: a technical overview. IEEE signal pro- cessing magazine, 20(3):21–36, 2003. 1 [42] B. Romera-Paredes and P. H. S. Torr. Recurrent instance
- segmentation. In ECCV, 2016. 12
[43] C. Schuler, M. Hirsch, S. Harmeling, and B. Scholkopf. Learning to deblur. IEEE Transactions on Pattern Analysis & Machine Intelligence, (1):1–1, 2016. 3 [44] S. M. Seitz and S. Baker. Filter flow. In Proceedings of the IEEE Conference on Computer Vision and Pattern Recogni- tion (CVPR), 2009. 1, 2 [45] Q. Shan, J. Jia, and A. Agarwala. High-quality motion de- blurring from a single image. In Acm transactions on graph- ics (tog), volume 27, page 73. ACM, 2008. 1 [46] M.-Y. Shen and C.-C. J. Kuo. Review of postprocessing tech- niques for compression artifact removal. Journal of visual communication and image representation, 9(1):2–14, 1998. 1 [47] K. Simonyan and A. Zisserman. Very deep convolutional networks for large-scale image recognition. arXiv preprint arXiv:1409.1556, 2014. 4 [48] J. Sun, W. Cao, Z. Xu, and J. Ponce. Learning a convolu- tional neural network for non-uniform motion blur removal. In Proceedings of the IEEE Conference on Computer Vision and Pattern Recognition, pages 769–777, 2015. 1, 3, 5, 6, 13, 14 [49] P. Svoboda, M. Hradis, D. Barina, and P. Zemcik. Compres- sion artifacts removal using convolutional neural networks. arXiv preprint arXiv:1605.00366, 2016. 3, 6 [50] A. Tarantola. Inverse problem theory and methods for model parameter estimation, volume 89. siam, 2005. 1 [51] R. Timofte, V. De Smet, and L. Van Gool. Anchored neigh- borhood regression for fast example-based super-resolution. In Proceedings of the IEEE International Conference on Computer Vision, pages 1920–1927, 2013. 7 [52] A. Vellido, J. D. Mart´ ın-Guerrero, and P. J. Lisboa. Mak- ing machine learning models interpretable. In ESANN, vol- ume 12, pages 163–172. Citeseer, 2012. 2 [53] G. K. Wallace. The jpeg still picture compression standard. IEEE transactions on consumer electronics, 38(1):xviii– xxxiv, 1992. 3 [54] Z. Wang, A. C. Bovik, H. R. Sheikh, and E. P. Simon- celli. Image quality assessment: from error visibility to structural similarity. IEEE transactions on image process- ing, 13(4):600–612, 2004. 4, 6
SLIDE 11
[55] O. Whyte, J. Sivic, A. Zisserman, and J. Ponce. Non-uniform deblurring for shaken images. International journal of com- puter vision, 98(2):168–186, 2012. 3 [56] L. Xu, J. S. Ren, C. Liu, and J. Jia. Deep convolutional neural network for image deconvolution. In Advances in Neural Information Processing Systems, pages 1790–1798, 2014. 3 [57] L. Xu, S. Zheng, and J. Jia. Unnatural l0 sparse represen- tation for natural image deblurring. In Proceedings of the IEEE conference on computer vision and pattern recogni- tion, pages 1107–1114, 2013. 5, 13 [58] C.-Y. Yang, C. Ma, and M.-H. Yang. Single-image super- resolution: A benchmark. In European Conference on Com- puter Vision, pages 372–386. Springer, 2014. 3 [59] J. Yang, J. Wright, T. S. Huang, and Y. Ma. Image super- resolution via sparse representation. IEEE transactions on image processing, 19(11):2861–2873, 2010. 1 [60] R. Zeyde, M. Elad, and M. Protter. On single image scale-up using sparse-representations. In International conference on curves and surfaces, pages 711–730. Springer, 2010. 4, 7 [61] Y. Zhang, Y. Tian, Y. Kong, B. Zhong, and Y. Fu. Resid- ual dense network for image super-resolution. In The IEEE Conference on Computer Vision and Pattern Recognition (CVPR), 2018. 1, 7
SLIDE 12 Appendix
In the supplementary material, we first show more visu- alizations to understand the predicted filter flows, then show if it is possible to refine the results by iteratively feeding de- blurred image to the same model for the task of non-uniform motion blur removal. We finally present more qualitative re- sults for all the three tasks studied in this paper.
- 1. Visualization of Per-Pixel Loading Factors
As a supplementary visualization to the principal com- ponents by PCA shown in the main paper, we can also vi- sualize the per-pixel loading factors corresponding to each principal component. We run PCA over testing set and show the first six principal components and the corresponding per-pixel loading factors as a heatmap in Figure 7. With this visualization technique, we can know what region has higher response to which component kernels. Moreover, given that the first ten principal components capture ≥ 99% filter energy (stated in the main paper), we expect future work to predict compact per-pixel filters using low-rank technique [25], which allows for incorporating long-range pixels through large predictive filters while with compact features (thus memory consumption is reduced largely).
- 2. Iteratively Removing Motion Blur
As the deblurred images are still not perfect, we are in- terested in studying if we can improve performance by it- eratively running the model, i.e., feeding the deblurred im- age as input to the same model one more time to get the
- result. We denote this method as PFF+1. Not much sur-
prisingly, we do not observe further improvement as listed in Figure 4, instead, such a practice even hurts performance
- slightly. The qualitative results are shown in Figure 8, from
which we can see the second run does not generate much change through the filter flow maps. We believe the reason is that, the deblurred images have different statistics from the original blurry input, and the model is not trained with such deblurred images. Therefore, it suggests two natural directions as future work for improving the results, 1) train- ing explicitly with recurrent loops with multiple losses to improve the performance, similar to [3, 33, 42, 27, 26], or 2) simultaneously inserting an adversarial loss to force the model to hallucinate details for realistic output, which can be useful in practice as done in [32] even for improving the aesthetics [28].
- 3. More Qualitative Results
In Figure 9, 10 and 11, we show more qualitative results for non-uniform motion blur removal, JPEG compression artifact reduction and single image super-resolution, respec-
- tively. From these comparisons and with the guide of filter
Figure 7: We show the original image, low-quality input and the high-quality output by our model as well as the mean kernel and filter flow maps on the left panel, and the first six principal components and the corresponding loading factors as heatmap on the right panel. Best seen in color and zoom- in. flow maps, we can see at what regions our PFF pays atten- tion to and how it outperforms the other methods.
SLIDE 13 Table 4: Comparison on motion blur removal over the non-uniform motion blur dataset [2]. PFF+1 means we perform PFF
- ne more time by taking as input the deblurred image by the same model.
Moderate Blur metric [57] [48] [2] CNN PFF PFF+1 PSNR 22.88 24.14 24.87 24.51 25.39 25.28 SSIM 0.68 0.714 0.743 0.725 0.786 0.783 Large Blur metric [57] [48] [2] CNN PFF PFF+1 PSNR 20.47 20.84 22.01 21.06 22.30 22.21 SSIM 0.54 0.56 0.624 0.560 0.638 0.633 Figure 8: We show deblurring results over some random testing images from the dataset released by [2]. We first feed the blurry images to PFF model, and obtain deblurred images; then we feed such deblurred images into the same PFF model again to see if this iterative practice refines the output. However, through the visualization that iteratively running the model changes very little as seen from the second filter flow maps. This helps qualitatively explain why iteratively running the model does not improve deblurring performance further.
SLIDE 14
Figure 9: Visual comparison of our method (PFF) to CNN [Sun, et al.] [48] and patch-optim [Bahat, et al.] [2] on more testing images released by [2]. Please be guided with the strong edges in the filter flow maps to compare visual details in the deblurred images by different methods. The last four rows show real-world blurry images without “ground-truth” blur. Note that for the last image, there is very large blur caused by the motion of football players. As our model is not trained on larger kernels which should be able to cover the size of blur, it does not perform as well as patch-optim [Bahat, et al.] [2]. But it is clear that our model generates sharp edges in this task. Best view in color and zoom-in.
SLIDE 15
Figure 10: Visual comparison between CNN and our method (PFF) for JPEG compression artifact reduction. Here we compress the original images using JPEG method with quality factor (QF) as 10. Best view in color and zoom-in.
SLIDE 16
Figure 11: Visual comparison between CNN and our method (PFF) for single image super-resolution. Here all images are super-resolved by 4× larger. We show in the first column the results by bicubic interpolation. Best view in color and zoom-in.