Image Analysis The topics of this lecture are (chapter 11) - - PowerPoint PPT Presentation

image analysis
SMART_READER_LITE
LIVE PREVIEW

Image Analysis The topics of this lecture are (chapter 11) - - PowerPoint PPT Presentation

Image Analysis The topics of this lecture are (chapter 11) Representation and description Chain codes Polygonal Approximations Skeletons Christina Olsn colsen@cs.umu.se Fourier descriptors Department of Computing Science Matlabs


slide-1
SLIDE 1

Image Analysis

Representation and description Christina Olsén colsen@cs.umu.se

Department of Computing Science Umeå University

March 3, 2009

Christina Olsén (CS, UmU) Representation and description March 3, 2009 1 / 35

The topics of this lecture are (chapter 11) Chain codes Polygonal Approximations Skeletons Fourier descriptors Matlab’s regionprops

Christina Olsén (CS, UmU) Representation and description March 3, 2009 2 / 35 Classification Representation Segmentation Discretization Problem domain Results Knowledge Preprocessing

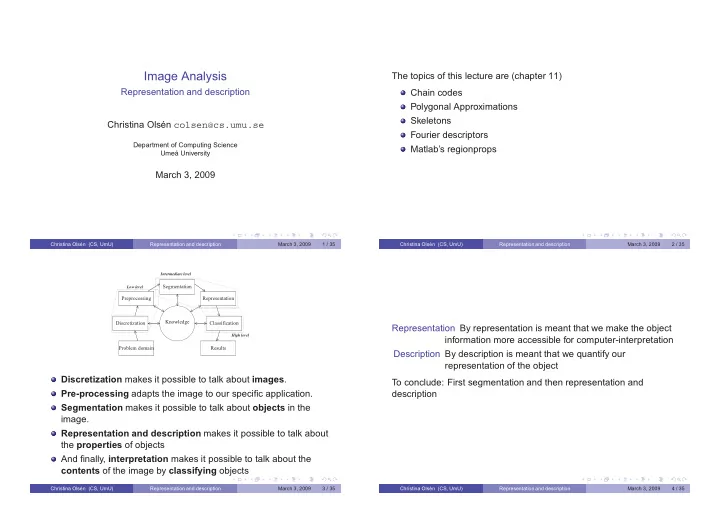
Low level Intermediate level High level

Discretization makes it possible to talk about images. Pre-processing adapts the image to our specific application. Segmentation makes it possible to talk about objects in the image. Representation and description makes it possible to talk about the properties of objects And finally, interpretation makes it possible to talk about the contents of the image by classifying objects

Christina Olsén (CS, UmU) Representation and description March 3, 2009 3 / 35

Representation By representation is meant that we make the object information more accessible for computer-interpretation Description By description is meant that we quantify our representation of the object To conclude: First segmentation and then representation and description

Christina Olsén (CS, UmU) Representation and description March 3, 2009 4 / 35

slide-2
SLIDE 2

Invariance

In all representation it is desirable to choose methods that are rotational, scale and translation invariant This mean that the calculated representation r(f(x, y)) is the same regardless if we translate: r(f(x, y)) = r(f(x, y) + [αx, αy]) scale: r(f(x, y)) = r(f(x, y) · [βx, βy]) rotate: r(f(x, y)) = r

  • f(x, y) ·

cos θ sin θ − sin θ cos θ

  • Christina Olsén (CS, UmU)

Representation and description March 3, 2009 5 / 35

Ursprungsbild (16x16) Roterad 27 grader Ursprungsbild (64x64) Roterad 27 grader

Christina Olsén (CS, UmU) Representation and description March 3, 2009 6 / 35

External

An external representation of an area is based on the the outer border of that area (i.e. the edge) We are not interested in the internal properties of the object (grey-level, color, texture etc), even if these were important to our ability to segment the object

Christina Olsén (CS, UmU) Representation and description March 3, 2009 7 / 35

Chain coding

Chain coding is based on the idea that we follow the outer edge

  • f the object and store the direction in which we are travelling

The directions are calculated as:

1 2 3 4 5 6 7 1 2 3

The chain code is of the same length as the perimeter of the

  • bject, which in many cases are too long

A solution to this is to re-sample the image to a lower resolution before calculating the code The re-sampling also reduces noise sensitivity

Christina Olsén (CS, UmU) Representation and description March 3, 2009 8 / 35

slide-3
SLIDE 3

The chain code is highly dependent on the starting point To reduce this dependency we regard the code as a circular number with n numerals. By finding the 1 ≤ i ≤ n that yields the lowest number when the chain code is read like a ordinary number we obtain a code that is invariant to starting point Ex 1. The code 0364700346 becomes 0034603647. To make the code even more robust we do not keep track of the absolute direction in which we are travelling, but only the changes in direction. This makes the code invariant to rotation Ex 2. The code 0034603647 becomes 0312233631

Christina Olsén (CS, UmU) Representation and description March 3, 2009 9 / 35 Christina Olsén (CS, UmU) Representation and description March 3, 2009 10 / 35

Polygonal approximation

It is also possible to represent an object by a polygon, that is a series of points connected by lines (often straight, but curved lines are possible) The polygon should with as few points as possible capture the characteristics of the object The simplest polygonal representation is to use the pixels on the perimeter of the object

Christina Olsén (CS, UmU) Representation and description March 3, 2009 11 / 35 1

Let i = 3

2

Mark the points in the object that have the furthest distance from each other with p1 and p2.

3

Connect the points in the order they are numbered with lines

4

For each segment in the polygon find the point on the perimeter between the points that have the furthest distance to the polygonal line-segment. If this distance is larger than a threshold mark the point with a label pi

5

Renumber the points so that they are consecutive

6

Increase i

7

If no points have been added break, otherwise go to 3.

Christina Olsén (CS, UmU) Representation and description March 3, 2009 12 / 35

slide-4
SLIDE 4

Convex hull

The convex hull H of a set S is defined as the smallest convex set that contains S We define the set D = H \ S. The points that have neighbors from the sets D, H and ∁H is called pi. These points are used for representation of the object

p

1

S D D D H p p p p p

2 3 4 5 6

To limit the number of points found it is possible to smooth the edge of the object

Christina Olsén (CS, UmU) Representation and description March 3, 2009 13 / 35

Skeletonizing

We define an objects skeleton or medial-axel as the points in the object that have several nearest neighbors on the edge of the

  • bject

Christina Olsén (CS, UmU) Representation and description March 3, 2009 14 / 35

To find the skeleton by using the definition is very costly, since it involves calculating the distance between all points in the object to all points on the perimeter Usually some iterative method is used that removes perimeter pixels until only the skeleton remains In order to achieve this, the following rules must be adhered to:

(a) erosion of the object must be kept to a minima (b) connected components must not be broken (c) end points must not be removed

Christina Olsén (CS, UmU) Representation and description March 3, 2009 15 / 35

Description

The purpose with the description is to quantify a representation of an object. This implies that we instead of talking about regions in the image we can talk about their properties, such as length, curviness, and so on

Christina Olsén (CS, UmU) Representation and description March 3, 2009 16 / 35

slide-5
SLIDE 5

Simple measures

One of the simplest descriptions is the length P of the perimeter of an object The obvious measure of perimeter-length is the number of edge

  • pixels. That is, pixel that do belong to the object, but have a

neighbor that belong to the background. A more precise measure is to assume that each pixel-center is a corner in a polygon The length of the perimeter is given by P = a · Ne + b · No

Christina Olsén (CS, UmU) Representation and description March 3, 2009 17 / 35

Intuitively we would like to set a = 1 and b = √ 2 It is, however, possible to show that the length of the perimeter will be slightly overestimated with these values The optimal weights for a and b (in least square sense) will depend on the curviness of the perimeter If the perimeter is a straight line (!?) a = 0.948 and b = 1.343 will be optimal

Christina Olsén (CS, UmU) Representation and description March 3, 2009 18 / 35

The diameter of an object is defined as Diam(B) = max

i,j [D(pi, pj)]

where D is a metric The line that passes through the points pi and pj that defines the diameter is called the main axis of the object The curviness of the perimeter can be obtained by calculating the angle between two consecutive line-segments of the polygonal approximation The curvature at point pj of the curve {pi}N

i=1 is also given by

c = ||pj−1 − 2pj + pj+1||2 where pi ∈ R2

Christina Olsén (CS, UmU) Representation and description March 3, 2009 19 / 35

We can approximate the area of an object with the number of pixels belonging to the object More accurate measures is, however, obtained by using a polygonal approximation The area of a polygon segment (with one corner in the origin) is given by dA=x2y1 − 1 2x1y1 − 1 2x2y2 + 1 2(x2 − x1)(y1 − y2)

Christina Olsén (CS, UmU) Representation and description March 3, 2009 20 / 35

slide-6
SLIDE 6

The area of the entire polygon is then A = 1 2

Nb

  • i=1

xiyi+1 − xi+1yi A circle of radius r has the area A = πr2 and the length of the perimeter is P = 2rπ so by defining the quotient P2A = P2 4πA we have a measurement that is 1 if the object is a circle. The larger the measurement the less circle-like is the object.

Christina Olsén (CS, UmU) Representation and description March 3, 2009 21 / 35

P2A = 11.9249 P2A = 0.8014 P2A = 1.2536

Christina Olsén (CS, UmU) Representation and description March 3, 2009 22 / 35

Shape

A measure of the shape of the object can be obtained according to:

1

Calculate the chain code for the object

2

Calculate the difference code for the chain code

3

Rotate the code so that it is minimal

4

This number is called the shape number of the object

5

The length of the number is called the order of the shape

Christina Olsén (CS, UmU) Representation and description March 3, 2009 23 / 35

The quotient between the length of the main axis and the largest width orthogonal to the main axis is called the eccentricity of the object. Given a order of the shape we can find the rectangle that best approximates the eccentricity of an object The rectangle is rotated so that it’s main axis coincide with the

  • ne of the object

This rectangle defines a re-sampling grid The shape number is then calculated on the re-sampled object

Christina Olsén (CS, UmU) Representation and description March 3, 2009 24 / 35

slide-7
SLIDE 7

Christina Olsén (CS, UmU) Representation and description March 3, 2009 25 / 35

Fourier descriptors

Suppose we have a perimeter of length N made out of coordinates (xi, yi). We then define the functions x(k) = xk, y(k) = yk and s(k) = x(k) + jy(k) for k = 0, 1, . . . , N − 1. The discrete Fourier transform of s(k) is a(u) = 1 N

N−1

  • k=0

s(k)e−j2πuk/N The complex coefficients a(u) is called the Fourier descriptors

  • f the object.

Christina Olsén (CS, UmU) Representation and description March 3, 2009 26 / 35

By using M ≤ N coefficients in the reconstruction of the object an approximation is obtained: ˆ s(k) =

M−1

  • u=0

a(u)ej2πuk/N Observe that it is still N points in the contour but that we use M frequencies to construct the object The information that is lost is the one found in the high frequencies

Christina Olsén (CS, UmU) Representation and description March 3, 2009 27 / 35

20 40 60 80 100 120 140 160 180 200 220 20 40 60 80 100 120 140 160 180 200 220 10 deskriptorer av 895 20 40 60 80 100 120 140 160 180 200 220 20 40 60 80 100 120 140 160 180 200 220 20 deskriptorer av 895

Christina Olsén (CS, UmU) Representation and description March 3, 2009 28 / 35

slide-8
SLIDE 8

20 40 60 80 100 120 140 160 180 200 220 20 40 60 80 100 120 140 160 180 200 220 30 deskriptorer av 895 20 40 60 80 100 120 140 160 180 200 220 20 40 60 80 100 120 140 160 180 200 220 40 deskriptorer av 895

Christina Olsén (CS, UmU) Representation and description March 3, 2009 29 / 35

20 40 60 80 100 120 140 160 180 200 220 20 40 60 80 100 120 140 160 180 200 220 100 deskriptorer av 895 20 40 60 80 100 120 140 160 180 200 220 20 40 60 80 100 120 140 160 180 200 220 200 deskriptorer av 895

Christina Olsén (CS, UmU) Representation and description March 3, 2009 30 / 35 Christina Olsén (CS, UmU) Representation and description March 3, 2009 31 / 35

Topologiska properties

Topology is the study of properties of an object that is not affected by deformation These properties are typically the number of connected component and holes that constitute an object The Euler number is defined as the number of connected components minus the number of holes

Christina Olsén (CS, UmU) Representation and description March 3, 2009 32 / 35

slide-9
SLIDE 9

regionprops

≫ IL=bwlabel(I); ≫ STATS=regionprops(IL,’all’); ≫ STATS(5).Area In image processing toolbox (ver. 3) there is a function regionprops that calculates a number of measurements for segmented objects The image must be segmented (i.e. binary) and labelled with bwlabel To label an images mean that we give a unique intensity level to each connected component The regionprops function returns an array with structures so that the i:th element corresponds to the i:th object

Christina Olsén (CS, UmU) Representation and description March 3, 2009 33 / 35

regionprops calculates around 20 different representations and descriptions for an object See help regionprops for more information

Christina Olsén (CS, UmU) Representation and description March 3, 2009 34 / 35

Area: 37 ConvexImage: [9x7 logical] Centroid: [126.8378 63.2432] ConvexArea: 57 BoundingBox: [123.5000 58.5000 7 9] Image: [9x7 logical] MajorAxisLength: 10.8813 FilledImage: [9x7 logical] MinorAxisLength: 7.5035 FilledArea: 44 Eccentricity: 0.7242 EulerNumber: 0 Orientation: -83.3742 Extrema: [8x2 double] ConvexHull: [19x2 double] Extrema: [8x2 double] ConvexImage: [9x7 logical] EquivDiameter: 6.8637 Solidity: 0.6491 Extent: 0.5873

Christina Olsén (CS, UmU) Representation and description March 3, 2009 35 / 35