
SLIDE 1
Center for Watershed Protection
Illicit Discharge Detection & Elimination Water Quality - - PowerPoint PPT Presentation
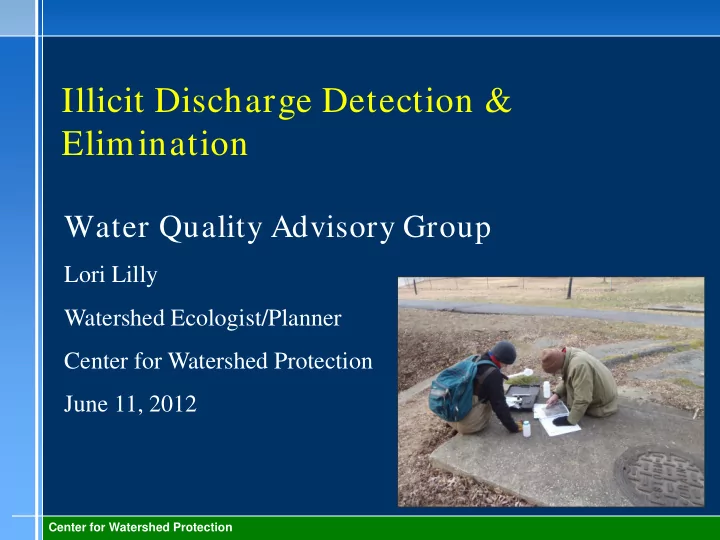
Illicit Discharge Detection & Elimination Water Quality Advisory Group Lori Lilly Watershed Ecologist/Planner Center for Watershed Protection June 11, 2012 Center for Watershed Protection Center for Watershed Protection National
Center for Watershed Protection
Center for Watershed Protection
Center for Watershed Protection
composition & mode of entry
disposal system & the storm drain system
sites”
Center for Watershed Protection
Center for Watershed Protection
Center for Watershed Protection
Center for Watershed Protection
Center for Watershed Protection
Center for Watershed Protection
Center for Watershed Protection
Parameters Analyzed
In the field Ammonia Sample 1 Fluoride Anionic Surfactants Potassium Sample 2 Total Nitrogen Total Phosphorus Sample 3
Center for Watershed Protection
Average Dry Weather Flow "Hit" Frequency for 5 Mid-Atlantic Watersheds 20 40 60 80 100 120 Any Wastewater Tap water Washwater Bacteria (co- indicator) Type of Indicator Percent
Center for Watershed Protection
Center for Watershed Protection
Center for Watershed Protection
Percentage of Total E.coli in Sligo Creek Outfalls
4% 20% 77% Suspect Outfalls "Clean" outfalls Obvious Sew age Discharge
Center for Watershed Protection
Center for Watershed Protection
1/ 1/24/ 24/201 2011 Ammon
1.04 m 04 mg/ g/l Flu luorid ide: e: 0.3 m mg/l /l Det Deter ergen ents: 0.25 m mg/l /l
col
6,000 000 CFU/100 m 100 ml
inspection revealed no connections
from Mansfield and between Mansfield and Dale on Wayne
3,489 lbs + ? TN & 88 + ? Lbs TP
1/ 1/24/ 24/201 2011 Ammon
1.04 m 04 mg/ g/l Flu luorid ide: e: 0.3 m mg/l /l Det Deter ergen ents: 0.25 m mg/l /l
col
6,000 000 CFU/100 m 100 ml
Center for Watershed Protection
1/10/2011 Ammonia: 3.62 mg/l Potassium: 31 ppm Detergents: 0.75 mg/l
Flow: 32,344 gallons/day
Center for Watershed Protection
Orig igin inal t l total l nit itrogen en lo load: 1. 1.47 l 47 lb/day As of
6/11/ 1/2012 2012 - ~16. 16.7 m 7 million
gallon
Tot
loa
= 767 767 lbs + + ? ?
Center for Watershed Protection
Center for Watershed Protection
Western Run - Dry Weather Load
500 1000 1500 2000 2500 3000 3500 4000
Total Nitrogen (lb/yr) Total Phosphorus (lb/yr)
All outfalls Suspect (exceed any criteria) Clean Load - Confirmed Sewage Discharge
Center for Watershed Protection
5 10 15 20 25 30 35 40 Discharge (MG/day) Total Nitrogen load (lb/day) Stream All Outfalls Suspect Outfalls Clean Outfalls
Center for Watershed Protection
Center for Watershed Protection
Center for Watershed Protection
*Based on load assumptions derived from CWP, 2008 and Phase I Watershed Implementation Plan estimates for the Chesapeake Bay TMDL.
Nitrogen TMDL Load Reduction Estimates for Western Run
5000 10000 15000 20000 25000 Western Run estimated baseline load Western Run TMDL target load lb/yr
Center for Watershed Protection
57% 43% Other activities Removal of illicit discharges
*Illicit discharge load estimates based on single grab sample
Center for Watershed Protection
*Assumes 50K per repair for 47 repairs **Assumes 100% of the water quality volume provided by treating 1" of rainfall
Cost Comparison
$0 $20,000,000 $40,000,000 $60,000,000 $80,000,000 $100,000,000 $120,000,000 Illicit Discharge Repair* Dry Swale Constructed Wetlands** Bioretention** Wet Swale Permeable Pavement** Practice Cost Total Nitrogen Total Phosphorus
Center for Watershed Protection Runoff Reduction*
2000000 4000000 6000000 8000000 10000000 12000000 Constructed Wetlands Illicit Discharge Repair Bioretention Permeable Pavement Practice Volume (gallons / 1" storm)
*Treats equivalent nitrogen load
Center for Watershed Protection
Center for Watershed Protection
Center for Watershed Protection
Center for Watershed Protection
Center for Watershed Protection
Center for Watershed Protection
Center for Watershed Protection
Center for Watershed Protection