II.7. Unemployment text, ch 6 42 Objectives: To understand the - - PDF document

ii 7 unemployment text ch 6 42 objectives to understand
SMART_READER_LITE
LIVE PREVIEW

II.7. Unemployment text, ch 6 42 Objectives: To understand the - - PDF document

II.7. Unemployment text, ch 6 42 Objectives: To understand the determinants of the long-run average rate of unemployment, or the natural rate of unemployment ; To understand the types of long-run unemployment, the reasons for their


slide-1
SLIDE 1

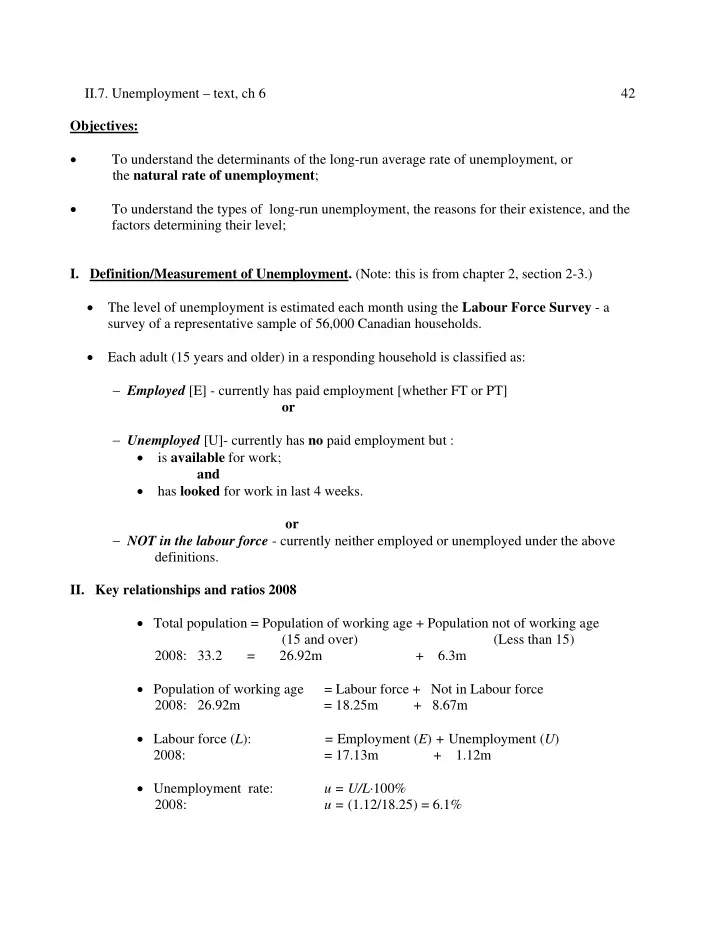
II.7. Unemployment – text, ch 6 42 Objectives:  To understand the determinants of the long-run average rate of unemployment, or the natural rate of unemployment;  To understand the types of long-run unemployment, the reasons for their existence, and the factors determining their level;

  • I. Definition/Measurement of Unemployment. (Note: this is from chapter 2, section 2-3.)

 The level of unemployment is estimated each month using the Labour Force Survey - a survey of a representative sample of 56,000 Canadian households.  Each adult (15 years and older) in a responding household is classified as: Employed [E] - currently has paid employment [whether FT or PT]

  • r

Unemployed [U]- currently has no paid employment but :  is available for work; and  has looked for work in last 4 weeks.

  • r

NOT in the labour force - currently neither employed or unemployed under the above definitions.

  • II. Key relationships and ratios 2008

 Total population = Population of working age + Population not of working age (15 and over) (Less than 15) 2008: 33.2 = 26.92m + 6.3m  Population of working age = Labour force + Not in Labour force 2008: 26.92m = 18.25m + 8.67m  Labour force (L): = Employment (E) + Unemployment (U) 2008: = 17.13m + 1.12m  Unemployment rate: u = U/L·100% 2008: u = (1.12/18.25) = 6.1%

slide-2
SLIDE 2

II.7. Unemployment – text, ch 6 43  Labour force participation rate: l = L/POP(aged 15 & over)·100% 2008: l = (18.26/26.92) = 67.8%

  • III. Problems with the “official” measure of unemployment:

 discouraged workers - those who have given up looking for work (including them in u would increase u by about 1.0 percentage point)  involuntary part-time unemployment (taking account of involuntary part-time unemployment would add about 1.0 percentage point to u)  but: those who claim they have looked for work but did not.

  • IV. Trends in labour force participation in Canada.

 Just after WWII, only one-third of Canadian women of working age were employed

  • r looking for work while seven-eights of working age men (88%) were in the labour

force; in 2005 62 percent of women were in the labour force in contrast to 73 percent

  • f men.

 The decline in the male labour force participation rate may be explained by the fact that men now tend to: stay longer in school; retire earlier; and some stay at home to raise children.  Many economists forecast a decline in labour force participation rates for both men and women over the next several decades. V. Canadian unemployment - The evidence of six decades. Data from 1950 to 2010 show  In every year the unemployment rate [u] has exceeded 2%;  Unemployment rate fluctuates in the short-run over the business cycle;  From 1950 to the 1990s, there was a long-run upward trend in u;  In this decade the average rate of unemployment had fallen to its level in the 1970s. DECADE APPROXIMATE AVERAGE UNEMPLOYMENT RATE [u] 1950s 4% 1960s 5% 1970s 7%

slide-3
SLIDE 3

II.7. Unemployment – text, ch 6 44 DECADE APPROXIMATE AVERAGE UNEMPLOYMENT RATE [u] 1980s 9% 1990s 10% 2000s 7% VI. The Natural Rate of Unemployment: Def 1: The natural rate of unemployment [u*] is the average level around which the measured rate of unemployment [u ] fluctuates.  Mankiw and Scarth estimate u* in a given year by averaging it over a span of 20 years, from 10 years earlier than the given year to 10 years later.  Increases until 1990, falls subsequently (Fig. 6-1) 1. A Simple Model of Natural Rate of u. Def 2: u* is the rate which is constant in the absence of shocks. Define: s = rate of job separation, or the (constant) fraction of the number of employed persons (E) who lose, or quit, their job in a given month. f = rate of job finding, or the (constant) fraction of the number of unemployed persons (U) who find a job in a given month. We have:  total flow out of unemployment each month = fU  total flow into unemployment each month = sE There is no change in unemployment if: fU = sE Since E = (L - U): fU/L = s(1-U/L)

slide-4
SLIDE 4

II.7. Unemployment – text, ch 6 45 Solving for U/L: u* = U/L = s/(s+f) Conclusion: the natural rate of unemployment depends on job separation rate and on job finding rate The natural rate of unemployment is lower if  The job finding rate is higher  The job separation rate is lower, Numerical example: s = 0.02; f=0.2u*=0.091 or 9.1% VII. Types of Unemployment and their Causes. 1. Job Search and Frictional Unemployment. Def: Frictional u - unemployment caused by the time it takes workers to find a job. (a) where it comes from - employment turnover:  sectoral shifts or shifting demands for labour across:

  • industries
  • regions

 technological change which reduces demand for certain types of labour;  business failure;  individual worker factors:

  • job dissatisfaction [quit]
  • poor job performance [firing]
  • geographical mobility of workers.

(b) why it lasts: Job search takes time because:  workers and jobs are not identical;  information is imperfect about job vacancies and job seekers;  there is geographic immobility of workers, at least in the short run;

slide-5
SLIDE 5

II.7. Unemployment – text, ch 6 46 (c) Public policies and frictional unemployment: Policies which reduce frictional unemployment:  govt. employment agencies which provide info. about job vacancies  govt.-funded retraining programs Policies which increase frictional unemployment:  Employment insurance [EI] program [previously called unemployment insurance

  • r UI] raises the rate of frictional unemployment by:

(i) lowering the rate of job finding

  • reduces the cost of long job search.

(ii) increasing the rate of job separations

  • easier to accept job loss;
  • employers use layoffs more often.

(d) Evidence on EI and unemployment  According to Canadian evidence, the probability of an unemployed worker finding a job increases as the worker nears the end of the period of eligibility for EI benefits;  An experiment in Illinois in 1985 showed that offering a bonus [$500] to unemployed workers if they found work within 11 wks. lowered the average duration of unemployment from 18.3 to 17 wks;.  Study by Benjamin and Kochin on unemployment in UK between WW I and WW II

  • increases in UI benefits coincided with increases in unemployment rate;
  • teenagers ineligible for UI had lower rate of unemployment

 unemployment rate for married women dropped significantly relative to that of men after their UI benefits were cut in 1932. 2. Real-Wage Rigidity and Structural Unemployment. (a) real wage rigidity - failure of wages to adjust until labour demand equals labour supply- leads to job rationing. (b) The unemployment arising from real wage rigidity and job rationing is called structural unemployment - unemployment due to a fundamental mismatch between demand and supply

  • f labour.
slide-6
SLIDE 6

II.7. Unemployment – text, ch 6 47 (c) Reasons for real wage rigidity: (i) Minimum wage laws

  • Has greatest impact on teenage unemployment; studies have shown that a 10% increase in

minimum wage reduces teenage employment by 1-3%

  • Other evidence:

1985: Man, Sask had the highest minimum wages in Canada, Alberta, BC - lowest. Ratio of youth to adult unemployment: 2.9 - Manitoba 2.6 - Saskatchewan 1.9 - BC 1.8 - Alberta

  • Many economists believe that refundable income tax credits are a better way to

increase the incomes of the working poor; in comparison to the minimum wage, refundable income tax credits don’t raise labour costs to firms and, hence, don’t reduce employment. (ii) Unions - “ insiders and outsiders”

  • raise wages above market clearing through collective bargaining;
  • raise wages at nonunionized firms (to ward off unionization).

(iii) Efficiency wages Idea: higher wages make workers more productive Reasons: higher wages lead to:

  • lower turnover
  • higher effort
  • higher average quality of workers
  • better nutrition.
  • VIII. Patterns of Unemployment in Canada:

(a) Incidence and Duration  The rate of unemployment is the product of two factors the incidence of unemployment (the likelihood than an individual worker will experience a spell of unemployment) and the duration of unemployment (the average length of an unemployment spell).  In 2005 the incidence of unemployment was 2.6 percent (the average worker had a 2.6 percent chance of becoming unemployed in any given month in 2005) and the duration was

slide-7
SLIDE 7

II.7. Unemployment – text, ch 6 48 16 weeks (on average a spell of unemployment lasted 4 months). An increase in the unemployment rate is associated with an increase in both the incidence and the duration of unemployment. Earlier evidence: about 2/3 of the increase in unemployment rate is due to an increase in duration and about 1/3 is due to an increase in incidence. A new study: mostly changes in incidence; the duration is fairly constant at 2.3 months $ (b) Age distribution in 2007 - Table 6-2. 15-19 14.8% 20-24 8.7% 25-54 5.1% 55+ 4.8% (c) Geographical (Provincial) distribution in 2006: N.L. - 14.8% N.S. - 7.9% QUE - 8.0% MAN - 4.3% ALTA - 3.4% P.E.I. - 11.0% N.B. - 8.8% ONT - 6.3% SASK - 4.7% B.C. - 4.8% (d) Explaining the upward drift in u from 1950s to 1990s  changing composition: more young workers, women; but can’t explain the upward drift in prime-age male unemployment (from below 3% in ‘50s to 9% in the ‘90s); also some of demographic changes of the 1970s have been reversed.  faster sectoral shifts due to

  • increased pace of technological change;
  • more volatile natural resource prices (particularly oil prices);

 skill-biased technical change which in Canada (in contrast to the US ) has meant lower employment rather than lower wages due to limited competitiveness of the Canadian economy.