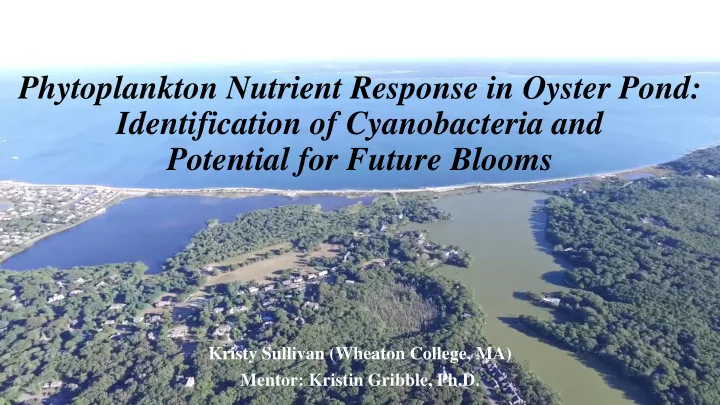

Phytoplankton Nutrient Response in Oyster Pond: Identification of Cyanobacteria and Potential for Future Blooms Kristy Sullivan (Wheaton College, MA) Mentor: Kristin Gribble, Ph.D .
Are cyanobacteria present in the water and/or overwintering in the sediment? What nutrient conditions could stimulate a bloom next summer?
• Oyster Pond water profiles • Water incubations (Control, P, N, N & P) • Sediment incubations (Control, P, N, N & P) • Fluorescence • Cyanobacteria counts • Microscopy • PCR & sequencing
Microcystis
Aphanocapsa
• Microcystin synthetase gene B (350 bp) • Part of 10 gene cluster involved in biosynthesis of microcystin 3000 bp • 16S rRNA gene (700 bp) 1000 bp 700 500 bp 350 A? A M Neg A M
Filamentous Cyanobacteria Non- Filamentous Other bacteria
6000 Microcystis colonies in Sediment 5000 Average # Colonies mL -1 4000 3000 2000 1000 0 Initial Control P N N & P
Microcystis cell counts 4500 4000 3500 Microcystis cells mL -1 3000 2500 2000 1500 1000 500 0 Water Sediment Water -500 Control P N N & P
Aphanocapsa cell counts 120,000 100,000 Aphanocapsa cells mL -1 80,000 60,000 40,000 20,000 0 Water Sediment Water Control P N N & P
Average Fluorescence Water Incubation #2 9.00 8.00 Fluorescence (µg L -1 ) 7.00 6.00 5.00 4.00 3.00 2.00 1.00 0.00 0 1 2 3 4 5 6 7 8 Days Control P N N & P
Average Fluorescence Sediment Incubation 18 16 Fluorescence (µg L -1 ) 14 12 10 8 6 4 2 0 0 2 4 6 8 10 12 Days Control Avg P Avg N Avg N & P Avg Sed C Water
Average Fluorescence Sediment Incubations, Replicates 1 & 2 18 16 Fluorescence (µg L-1) 14 12 10 8 6 4 2 0 0 2 4 6 8 10 12 14 Days Sed Control Sed P Sed N Sed N & P Neg Sed Control
Conclusions • If salinity stays <2 ppt, 2 1.8 there could be another 1.6 bloom 1.4 Average Salinity (ppt) • Microcystis is present in 1.2 the sediment 1 0.8 • Microcystis and 0.6 Aphanocapsa produce 0.4 microcystin 0.2 0 8/18 9/7 9/27 10/17 11/6 11/26 12/16 OP1 OP2 OP3 Weir
Special thanks to… Kristin Gribble Ken Foreman Rich McHorney SES TAs Wendi Buesseler Bill Kerfoot Jim McIlvain Louis Kerr
Recommend
More recommend