ICES Benchmark Workshop on West of Scotland herring (including Celtic - - PDF document

ices benchmark workshop
SMART_READER_LITE
LIVE PREVIEW

ICES Benchmark Workshop on West of Scotland herring (including Celtic - - PDF document

3/2/2015 ICES Benchmark Workshop on West of Scotland herring (including Celtic Sea, VIIg,j herring) (WKWEST 2015) Monday 2 February Friday 6 February 2015, Dublin, Ireland ICES Chair: Richard Nash, Norway External Chair: Steve Cadrin, USA


slide-1
SLIDE 1

3/2/2015 1 ICES Benchmark Workshop

  • n West of Scotland herring (including

Celtic Sea, VIIg,j herring)(WKWEST 2015)

Monday 2 February – Friday 6 February 2015, Dublin, Ireland

ICES Chair: Richard Nash, Norway External Chair: Steve Cadrin, USA Invited Experts: Tim Miller, US and Gary Melvin, Canada Professional secretary: Anne Cooper

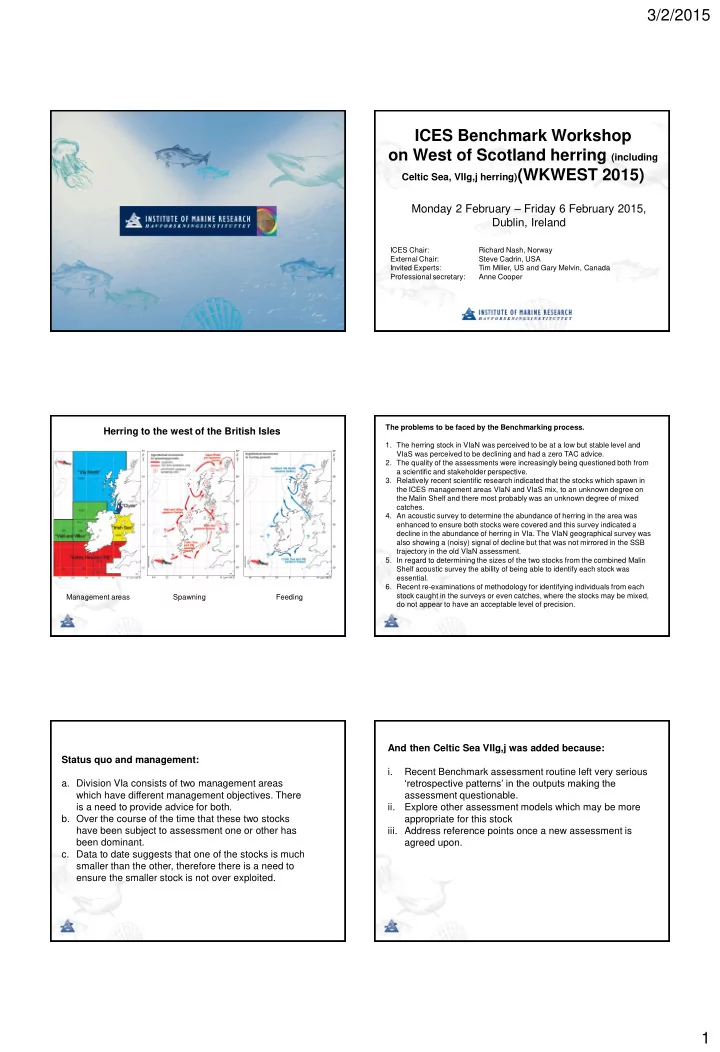
Herring to the west of the British Isles

Management areas Spawning Feeding The problems to be faced by the Benchmarking process.

  • 1. The herring stock in VIaN was perceived to be at a low but stable level and

VIaS was perceived to be declining and had a zero TAC advice.

  • 2. The quality of the assessments were increasingly being questioned both from

a scientific and stakeholder perspective.

  • 3. Relatively recent scientific research indicated that the stocks which spawn in

the ICES management areas VIaN and VIaS mix, to an unknown degree on the Malin Shelf and there most probably was an unknown degree of mixed catches.

  • 4. An acoustic survey to determine the abundance of herring in the area was

enhanced to ensure both stocks were covered and this survey indicated a decline in the abundance of herring in VIa. The VIaN geographical survey was also showing a (noisy) signal of decline but that was not mirrored in the SSB trajectory in the old VIaN assessment.

  • 5. In regard to determining the sizes of the two stocks from the combined Malin

Shelf acoustic survey the ability of being able to identify each stock was essential.

  • 6. Recent re-examinations of methodology for identifying individuals from each

stock caught in the surveys or even catches, where the stocks may be mixed, do not appear to have an acceptable level of precision.

Status quo and management:

  • a. Division VIa consists of two management areas

which have different management objectives. There is a need to provide advice for both.

  • b. Over the course of the time that these two stocks

have been subject to assessment one or other has been dominant.

  • c. Data to date suggests that one of the stocks is much

smaller than the other, therefore there is a need to ensure the smaller stock is not over exploited. And then Celtic Sea VIIg,j was added because: i. Recent Benchmark assessment routine left very serious ‘retrospective patterns’ in the outputs making the assessment questionable. ii. Explore other assessment models which may be more appropriate for this stock

  • iii. Address reference points once a new assessment is

agreed upon.

slide-2
SLIDE 2

3/2/2015 2

Commercial landings/catches for Area VIaN and VIaS, VIIg,j (2013)

Herring acoustic surveys undertaken around the west, north and east of the British Isles (mature autumn spawners)

Biomass of mature autumn spawning herring in June – July 2013 Biomass of immature autumn spawning herring in June – July 2013

Herring acoustic surveys undertaken around the west, north and east of the British Isles (immature autumn spawners)

Scottish Ground fish Survey – Quarter 1 Scottish Mackerel Recruit Survey – Quarter 4

  • 12
  • 10
  • 8
  • 6
  • 4
  • 2

50 52 54 56 58 60 Longitude Latitude D7 D9 E1 E3 E5 E7 27 28 29 30 31 32 33 34 35 36 37 38 39 40 41 42 43 44 45 46 47 48 49 50 51 52

VIa Vb VIIa VIIb VIIj VIIg VIIh VIIe

Haul positions 1986-2010 Survey changed from ICES rectangle based (similar to North Sea IBTS) to a semi-stratified random design. Similar station coverage though. Treat as two different surveys. Index areas: 1 whole of VIa, 2 VIaN, 3 VIaS.

1 2

Internal consistency: Can the survey follow year classes through successive years? Body Morphometry Otolith Shape

CELTIC SEA IRISH SEA VIaN VIaS CELTIC SEA 141 5 4 IRISH SEA 4 162 1 VIaN 4 231 22 VIaS 3 6 12 348 S01 - CELTIC SEA S06 - IRISH SEA VIaN VIaS IRL Donegal1 0.04 0.04 0.13 0.79 IRL Donegal2 0.04 0.02 0.14 0.80 SCO S08 Hebrides 0.00 0.05 0.48 0.47 SCO S10 Cape Wrath 0.01 0.05 0.48 0.46 2004/05 baseline - WESTHER New samples – 2014/15

Identification of individuals to stocks Ecosystem drivers – a changing environment

Variability in surface temperature

  • f coastal waters around

Scotland.

Long-term (1900-2006) variability in

  • ceanic temperatures to the north of

Scotland and east of Faroe (including the Northern Hemisphere (NH) (source NOAA). Dashed lines: 1980-2006 (0.24°C per decade) 1900-2006 (0.04°C per decade) Salinity (1970-2006) Temperature (1970-2006) North of Scotland, east of Faroe, west of Scotland and the northern North Sea.

slide-3
SLIDE 3

3/2/2015 3

Natural mortality (M) issues and predation

Estimates of natural mortality by age

Use of information from the industry

In 2014 the fishing industry encountered and documented a large aggregation of herring (dimensions 2.7 by 1km). Using density estimates from other surveys of aggregations and reasonable potential packing densities and mean weights, an ad hoc and very subjective estimate of 27,000t was generated. This would be very substantial part of the assumed biomass at the time. Again in 2015 large aggregations of herring were observed and recorded in the area. The information as collected and reported cannot be used in a quantitative matter to evaluate the stock status, however, it does confirm that relatively large aggregations of fish are being observed during the spawning season in the region, their abundance may be increasing and that these biomass observations should be investigated.

Proceeding to an assessment

  • 1. Neither VIaN nor VIaS provided reliably stable

assessments.

  • 2. A combined VIa, VIIb,c assessment was reasonably

stable

  • 3. Work on the assumption of mass balance i.e. the

assessment of both together was a simple summation

  • f both
  • 4. Initial hope was either an assessment of either VIaN
  • r VIaS was possible and the difference between the

two was the size of the missing stock

  • 5. An alternative was a method of determining the

relative sizes of each stock so the total abundance could be partitioned between the two stocks.

  • 6. Methods of achieving 5 were explored.

VIa, VIIb,c assessment – looking for quality Three different models explored: 1. Separable VPA, 2. Integrated Catch Analysis (ICA) and 3. State-space stock assessment model (SAM). (looking for small and random variations in the residuals to model fits and small and random retrospective patterns)

Examples of bubble plots of residuals from Separable VPA and SAM

The SAM model approach was chosen as the best All four surveys (1. Acoustic survey for VIaN, and 2. Malin Shelf series, plus 3. 1st Quarter Bottom trawl survey and 3. 3rd Quarter Bottom trawl survey) were included. There were no statistical reasons for removing any of the survey indices from the assessment.

Where does this leave us with area VIa, VIIb,c and the two management areas.

  • 1. We can determine the biomass of herring that can be

found to the west of the British Isles (in Area VIa, VIIb,c).

  • 2. Of that biomass we can not (at present) reliably

estimate the proportions that can be considered as spawning in each of the two ICES management areas i.e. VIaN and VIaS, VIIb,c. The Benchmark will Report to ICES and the HAWG Final assessment using 2015 updated data will be undertaken at the HAWG HAWG will present management recommendations through the standard ICES channels

slide-4
SLIDE 4

3/2/2015 4

Celtic Sea VIIg,j (short summary)

Last Benchmark switched from ICA to SAM. Problem with the retrospectives when taken to assessment in 2014. Various models tested and ASAP (A Stock Assessment Program) is an age-structure stock assessment modeling program, chosen based on analytical criteria that assesses the level of retrospective patterns (rho).

Natural mortality issues – again/as well

A considerable amount of work was carried out in 2014 and average modelled North Sea mortality rates for the years 1963 to 2010 were used. The North Sea herring underwent similar stock trajectories over time to this stock, and provided the basis for choosing these values. The overall choice was based on the following preferences: The new data varied mortality with age but did not try and ‘guess’ the inter-annual variation in mortality.

1 2 3 4 5 6 7 8 9 0.793 0.377 0.351 0.322 0.312 0.307 0.301 0.301 0.301 1 2 3 4 5 6 7 8 9 0.706 0.353 0.280 0.255 0.240 0.226 0.217 0.217 0.217

Natural mortality schedule used in 2014 (average of 1963 to 2010) Natural mortality schedule used in 2015 (average of 1974-2013)

Retrospective patterns (2015 model) Comparison of 2014 model and settings versus 2015 model and settings

Blim Bpa MSY B trigger Management trigger Flim Fpa Fmanagement

WKWEST suggests little change, or none at all in management reference points relative to 2013 and 2014

Finally:

The one major exception being a lowering of FMSY from the un-realistically high level of 0.37 suggested in 2014.