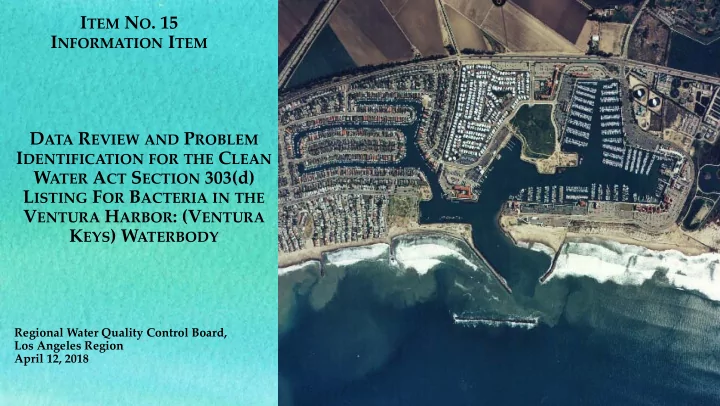
i tem n o 15
play

I TEM N O . 15 I NFORMATION I TEM D ATA R EVIEW AND P ROBLEM I - PowerPoint PPT Presentation

I TEM N O . 15 I NFORMATION I TEM D ATA R EVIEW AND P ROBLEM I DENTIFICATION FOR THE C LEAN W ATER A CT S ECTION 303(d) L ISTING F OR B ACTERIA IN THE V ENTURA H ARBOR : (V ENTURA K EYS ) W ATERBODY Regional Water Quality Control Board, Los


  1. I TEM N O . 15 I NFORMATION I TEM D ATA R EVIEW AND P ROBLEM I DENTIFICATION FOR THE C LEAN W ATER A CT S ECTION 303(d) L ISTING F OR B ACTERIA IN THE V ENTURA H ARBOR : (V ENTURA K EYS ) W ATERBODY Regional Water Quality Control Board, Los Angeles Region April 12, 2018

  2. Outline of Presentation • Environmental Setting • Bacteria Water Quality Standards – Basin Plan – State Water Board’s Proposed Bacteria Provisions • Review of historical data used to place the Ventura Harbor (Ventura Keys) on the 303(d) list • Review of water quality data from a special study conducted in 2008-09 • Staff Recommendation

  3. Environmental Setting • Located in Ventura Miscellaneous Coastal Watershed Management Area • Divided into two areas • Ventura Marina • Ventura Keys • Ventura Marina • 274-acre recreation and commercial marina • Owned by the Ventura Port District • Ventura Keys • 40-acre residential marina • Managed by City of Ventura

  4. Environmental Setting • Located in Ventura Miscellaneous Coastal Watershed Management Area • Divided into two areas • Ventura Marina • Ventura Keys • Ventura Marina • 274-acre recreation and commercial marina • Owned by the Ventura Port District • Ventura Keys • 40-acre residential marina • Managed by City of Ventura

  5. Basin Plan Objectives for Marine Waters Indicator Geometric Mean Single Sample Enterococcus 35/100ml 104/100ml Fecal coliform 200/100ml 400/100ml Total coliform * 1,000/100ml 10,000/100ml *Total coliform density shall not exceed 1,000/100 ml, if the ratio of fecal-to-total coliform exceeds 0.1.

  6. Proposed Bacteria Provisions for Marina Waters Geometric Mean Statistical Threshold Indicator (cfu/100ml) Value (STV) (cfu/100ml) Enterococcus 30/100ml 110/100ml cfu = colony forming units Geometric Mean • Minimum of five samples distributed over a six-week period • Six-week rolling Geometric Mean, calculated weekly Statistical Threshold • Not exceeded more than 10 percent of the samples collected in a single month’s time.

  7. Ventura Harbor (Ventura Keys) 2016 Integrated Report Assessment for Indicator Bacteria • Data Submitted by City of Ventura • Three Ventura Keys sites (K1- K3) and one Ventura Harbor site (M2) • Samples collected approximately weekly from January 2003 to August 2007

  8. Ventura Harbor: Ventura Keys 2016 Integrated Report Assessment for Indicator Bacteria Findings Enterococcus • Single sample: 48/595 exceeded • 30-day geometric mean: 41/432 exceeded Fecal coliform • Single sample: exceeded 24/648 exceeded • 30-day geometric mean: 3/464 exceeded Total coliform • Single sample: 64/648 exceeded • 30-day geometric mean: 196/464 exceeded Conclusion: Impaired by Total Coliform 30-day geometric mean= 30-day rolling Geometric Mean

  9. City of Ventura Data Compared to Proposed Bacteria Provisions- Ventura Keys Enterococcus Six-week Geometric Mean Total (30/100ml) # Exceedances 54 # Samples 420 # Exceedances to List 1 70 1 State Water Board’s Listing Policy Table 3.2 Data collected from Jan. 2003-Aug. 2007

  10. 2008 UCLA Contract Sampling • Bacterial contamination source tracking in Ventura Marina, Ventura Keys and in Arundell Barranca. • Samples collected monthly from May 2008- April 2009. • Nine Ventura Keys sites: • D1-D6 • Sailor • Beachmont • Marpark • One Ventura Harbor site: • Mardock

  11. UCLA Data Compared to Proposed Bacteria Provisions- Ventura Keys Enterococcus STV Objective Total (110/100ml) # Exceedances 19 # Samples 78 # Exceedances to List* 13 STV= Statistical Threshold Value-used when insufficient samples available to calculate a geometric mean *State Water Board’s Listing Policy Table 3.2 Data collected from May 2008-Apr. 2009

  12. UCLA Data Compared to Proposed Bacteria Provisions- Ventura Marina Enterococcus STV Objective Total (110/100ml) # Exceedances 1 # Samples 14 # Exceedances to List* 5 STV= Statistical Threshold Value-used when insufficient samples available to calculate a geometric mean *State Water Board’s Listing Policy Table 3.2 Data collected from May 2008-Apr. 2009

  13. Data Review Summary • Re-Assessment of the City of Ventura data using the Proposed Bacteria Provisions indicates no impairment in Ventura Keys – Data is 10 years old • Assessment of the UCLA data using the Proposed Bacteria Provisions indicates that there is an impairment in Ventura Keys, but not Ventura Marina – Data is 10 years old – Dataset is only 1 year of data, collected monthly

  14. Staff Recommendations • Request more frequent monitoring in Ventura Keys and Marina • Request the City of Ventura and the Ventura Harbor Port District to conduct bacteria monitoring for a minimum of two years – Until the Proposed Bacteria Provisions are adopted monitor for fecal coliform, total coliform, and enterococcus – Minimum of 5 sampling locations within the Ventura Keys and Ventura Marina • Assess the data collected from the bacteria monitoring program to determine the impairment status of the Ventura Harbor. • Develop TMDL if needed

Download Presentation
Download Policy: The content available on the website is offered to you 'AS IS' for your personal information and use only. It cannot be commercialized, licensed, or distributed on other websites without prior consent from the author. To download a presentation, simply click this link. If you encounter any difficulties during the download process, it's possible that the publisher has removed the file from their server.

Recommend


More recommend