
SLIDE 1
Alan Roseman -- University of Manchester
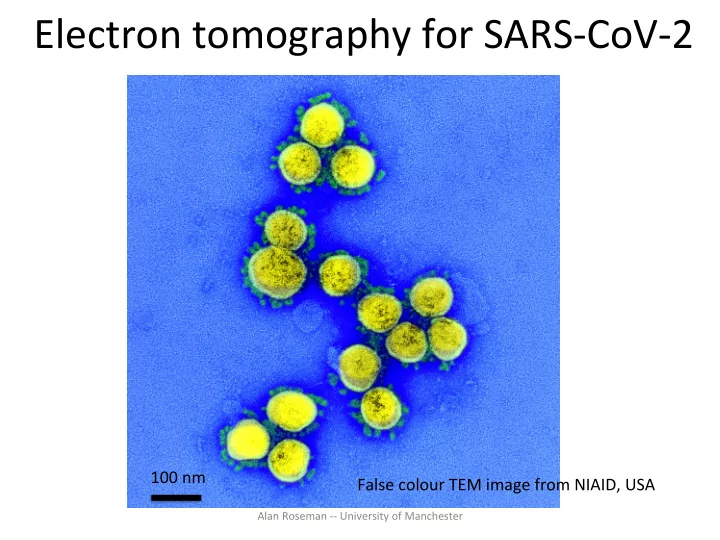
Electron tomography for SARS-CoV-2
False colour TEM image from NIAID, USA 100 nm
Electron tomography for SARS-CoV-2 100 nm False colour TEM image - - PowerPoint PPT Presentation
Electron tomography for SARS-CoV-2 100 nm False colour TEM image from NIAID, USA Alan Roseman -- University of Manchester FEI Polara 300 kV TEM in FLS, UoM. Nextstrain Alan Roseman -- University of Manchester Alan Roseman -- University of
Alan Roseman -- University of Manchester
False colour TEM image from NIAID, USA 100 nm
Alan Roseman -- University of Manchester
Alan Roseman -- University of Manchester
Alan Roseman -- University of Manchester
Alan Roseman -- University of Manchester
Alan Roseman -- University of Manchester
Alan Roseman -- University of Manchester
Alan Roseman -- University of Manchester
Alan Roseman -- University of Manchester
100 nm
Alan Roseman -- University of Manchester
TEM of SARS-CoV-2 (from NIAID)
Alan Roseman -- University of Manchester TEM of SARS-CoV-2 (from NIAID)
Alan Roseman -- University of Manchester
virus surface 25 nm
Alan Roseman -- University of Manchester
100 nm
TEM of SARS-CoV-2 (from NIAID)
Alan Roseman -- University of Manchester
Alan Roseman -- University of Manchester
Alan Roseman -- University of Manchester
100 nm MHV cryoET, MHV is also a betacoronavirus
Alan Roseman -- University of Manchester
Alan Roseman -- University of Manchester
Alan Roseman -- University of Manchester
Alan Roseman -- University of Manchester
100 nm
Alan Roseman -- University of Manchester
Figure S3. Cryo-EM data processing workflow Cryo-EM structure of the 2019-nCoV spike in the prefusion conformaCon . Wrapp et al, Science 2020.
Alan Roseman -- University of Manchester
Extended Data Figure 2 from: A.C. Walls, M.A. Tortorici, B.J. Bosch, B. Frenz, P.J.M. Ro_er, F. DiMaio, F.A. Rey, D. Veesler Cryo-electron microscopy structure of a coronavirus spike glycoprotein trimer Nature, 531 (2016), pp. 114-117 Scale bars: 573 Å (micrograph) and 44 Å (class averages)
CryoEM image of isolated coronavirus spike proteins
2D class averages
WT cores WT fab labelled
Alan Roseman -- University of Manchester
Alan Roseman -- University of Manchester
ACE2
Adapted from: Vivian A. Scheuplein et al. J. Virol. 2015; doi:10.1128/JVI.03607-14
Alan Roseman -- University of Manchester
The atomic models of the spike were determined by Walls et al (2020), using the cryoEM “single parPcle” method. Stabilised soluble spike proteins were produced in isolaPon, from mutated gene sequences, in lab grown cells. Structure, FuncCon, and AnCgenicity of the SARS-CoV-2 Spike Glycoprotein Alexandra C. Walls, Young-Jun Park, M. Alejandra Tortorici, Abigail Wall, Andrew T. McGuire, David Veesler
Alan Roseman -- University of Manchester
Alan Roseman -- University of Manchester
Alan Roseman -- University of Manchester
Alan Roseman -- University of Manchester
Alan Roseman -- University of Manchester
Alan Roseman -- University of Manchester
virus surface anPbody spikes
Alan Roseman -- University of Manchester
ACE2
Alan Roseman -- University of Manchester
All general ET sample and dose issues
Missing wedge Defocus/height dependent contrast transfer funcPon Dose damage, low signal DeformaPon/flow of sample
MulPple overlapping moPfs. Unknown level of variability.
Notes Rec. R. Soc. Lond. 2004. Medical Research Council - Laboratory of Molecular Biology Cambridge Jo Butler, Samantha Wynne, John Berriman
Nature, Vol 455|4 September 2008|doi:10.1038/nature07159
This raw cryoEM data has been processed to resolve the capsid protein moPf to 3.1Å resoluPon, using sub-tomogram averaging. It has all the features of a good tomography dataset. The moPf is hexameric, and is probably not very heterogeneous. The challenge for coronaviurs is that in addiPon to a missing wedge, dose damage, etc; it has mulPple overlapping moPfs (the spikes) with an unknown level of variabiliy. Databank reference for images: EMPIAR-10164 hjps://www.ebi.ac.uk/pdbe/emdb/empiar/entry/10164/ This HIV-1 capsid protein moPf has been resolved and analysed, and published 3 Pmes:
assembly and maturaPon. Science 353, 506–508 (2016). 3.9Å, EMD-4015
electron tomography using NovaCTF improves subtomogram averaging resoluPon to 3.4Å. J. Struct.
tomography and subtomogram averaging .Nature Methods, volume 15, pages. 955–961 (2018). 3.1Å, EMD-8986
Alan Roseman -- University of Manchester