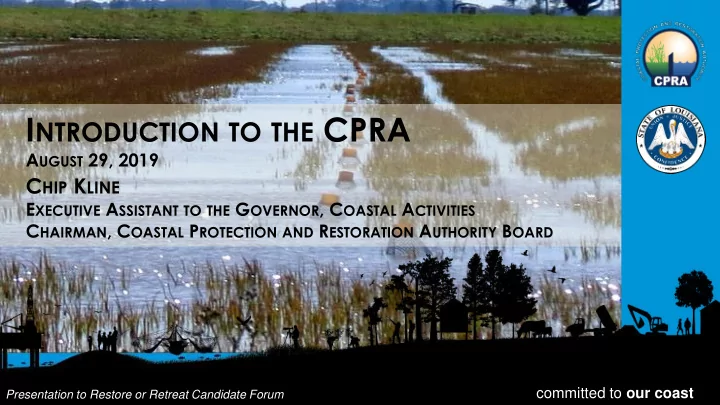

I NTRODUCTION TO THE CPRA A UGUST 29, 2019 C HIP K LINE E XECUTIVE A SSISTANT TO THE G OVERNOR , C OASTAL A CTIVITIES C HAIRMAN , C OASTAL P ROTECTION AND R ESTORATION A UTHORITY B OARD committed to our coast Presentation to Restore or Retreat Candidate Forum
Louisiana Faces a Coastal Crisis 2,006 SQUARE MILES OF LAND LOST 1932 – 2016
Causes of Land Loss Today Storms Sea Level Rise Oil Spill Subsidence Oil and Gas Infrastructure Levees Canals
Future Without Action | Medium Scenario | Year 50 Looking Forward…. Future Without Action - Year 50 4,100 SQUARE MILES OF LAND LOST
Hurricanes Katrina and Rita: New Beginning 5
CPRA 6
CPRA BOARD MEMBERSHIP 7
Master Plan: Project Selection Decision Drivers www.coastal.la.gov
A Framework to Make Difficult Decisions • Updated every 6 years • Articulates an integrated and comprehensive vision • Provides a list of projects • Resource constrained 2017 Coastal Master Plan 9
Master Plan: Project Selection Decision Drivers www.coastal.la.gov
Publically informed: MP17 Engagement www.coastal.la.gov
What the Master Plan 2017 Delivers 4 www.coastal.la.gov
Accomplished since 2007 www.coastal.la.gov
The Storms… Hurricanes Mississippi Gustav River and Hurricane High Water Ike Isaac 2008 2012 2019 2005 2016 2010 Hurricanes Unnamed BP Katrina Coastal Oil and System Spill Rita “Rain Bomb”
Total Projected Expenditures FY20, FY21, FY22 FY20 TOTAL Projected Expenditures $748 Million FY21 TOTAL FY22 TOTAL Projected Expenditures Projected Expenditures $788 Million $945 Million Operation, Maintenance, Engineering & Design Operating Construction Programs Planning Monitoring Costs
Terrebonne/Lafourche Active Projects PROJECT TYPE # Total Estimated Cost Barrier Island/Headland Restoration 2 $182,284,094.00 Hurricane Protection 13 $595,615,533.00 Marsh Creation 6 $298,193,890.00 Vegetative Planting 1 $126,000,000.00 Recreational Infrastructure 2 $8,000,000.00 Diversion (Atchafalaya to Terrebonne) 1 $415,215,000.00 Grand Total 25 $1,625,308,517.00
Terrebonne/Lafourche Barrier Islands
Bayou Chene Barge Gate 18
Houma Navigation Canal Lock 19
Morganza to the Gulf
High Performance Risk Reduction Projects Morganza to the Gulf Lake Pont. Barrier West Shore Larose to Golden Meadow Slidell Ring Levee GNO High Level Houma Nonstructural Upper Barataria R. R. St. Tammany NonStruc. Hahnville/Luling Nonstruc. 21
STATE Investments to Date: $281.6M DOTD $235M CPRA Statewide Flood – $25.8M GOMESA Pre-CPRA Control DOTD – $15.1M CDBG 3.0% Funding – $47.1M Capital Outlay 14.7% – $128.5M Surplus GOMESA Surplus 9.8% – $18.5M RESTORE 48.8% CDBG 5.7% $38.6 Pre-CPRA DOTD Capital Outlay Funding 17.9% $8M DOTD Statewide Flood Control 22
LOCAL Investments to Date: $234 Million Parish Investments $159M Bonds $41M Sales Tax Local State $34M Parish CDBG 45% 55% Total Funding State and Local: $515.6 Million 23
Where is Washington? • In 1992, Congress directed Corps to do a study • In 2000 and 2007, authorization sought from Congress • In 2014, MtG received $10.3 billion authorization • Today, $72 million of federal funding have been spent on studies and $0 on construction. Meanwhile…. 55 miles of continuous Levee protection, floodgates, and environmental structures have been constructed and 5 more miles are anticipated by 2020 24
Houma Region (Assumption, Lafourche, Terrebonne) • 5,700 businesses • 103,000 jobs • 36% of people commute in because of high paying, high skill jobs Top six industry sectors 1. Transportation and warehousing (includes pipelines and transportation to offshore) 2. Health Care and Social Assistance 3. Manufacturing 4. Retail Trade 5. Accommodation and Food Service 6. Oil and Gas Extraction 25
26
Coastal Risk – Year 25 • $933 Million in physical damages from land loss and loss of 4,800 jobs • $12.3 Billion in physical damages from a 100-year storm and $2.7 Billion annual losses to output from business disruption • Business losses in vulnerable coastal areas leads to lower employment, wages, and output in other regions. The loss of these jobs and businesses means fewer businesses are buying supplies and services from businesses in the Houma region. 27
Future Without Action | Medium Scenario | Year 50 Looking Forward…. Future Without Action - Year 50 4,100 SQUARE MILES OF LAND LOST
CONNECT WITH US! @ LouisianaCPRA www.coastal.la.gov
Recommend
More recommend