
SLIDE 1
0 8 0 5
Month Day Total No. of Stockholders Domestic Foreign LCU Cashier File Number Document ID
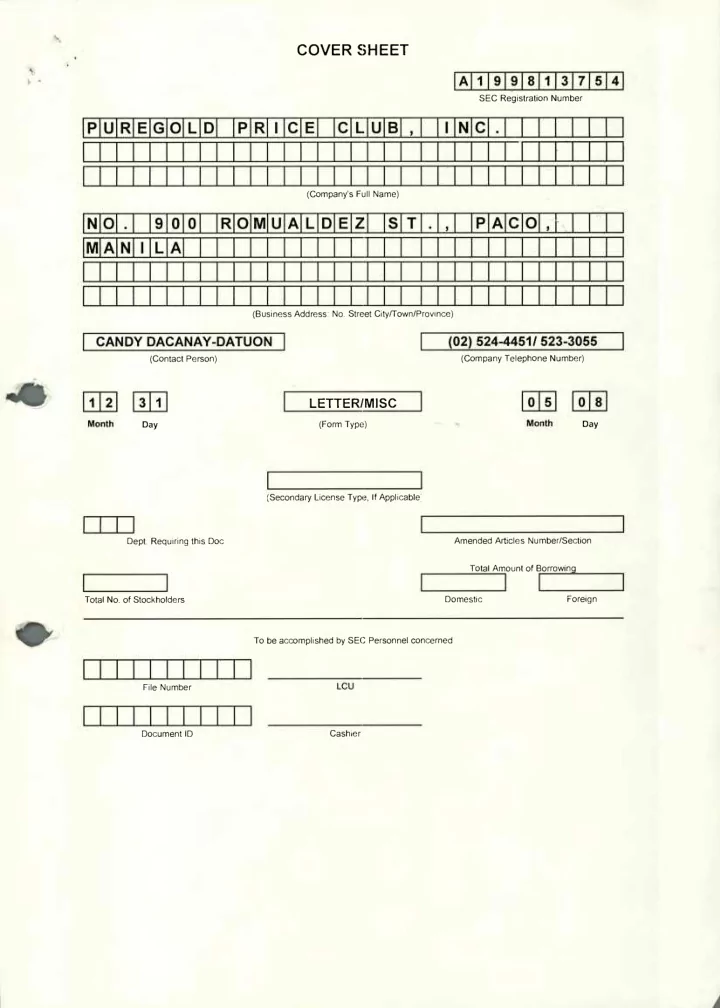
CANDY DACANAY-DATUON
(Contact Person)
(02) 524-4451/ 523-3055
(Company Telephone Number)
2 3
1
Month Day
- Dept. Requiring this Doc
LETTER/MISC
(Form Type) (Secondary License Type, If Applicablej Amended Articles Number/Section Total Amount of Borrowing To be accomplished by SEC Personnel concernedCOVER SHEET
A 1 9 9 8 1 3 7 5 4
SEC Registration Number
P U R E G O L D P R
C i E C L. U B
N C
(Company's Full Name)N O 9 0 0 R O M U A L D E S T P A C O
M
A N
L
A
(Business Address: No. Street City/Town/Province)