I-70 East Bound Peak Period Shoulder Lane April 23, 2019 Interstate - - PowerPoint PPT Presentation

i 70 east bound peak period shoulder lane april 23 2019
SMART_READER_LITE
LIVE PREVIEW

I-70 East Bound Peak Period Shoulder Lane April 23, 2019 Interstate - - PowerPoint PPT Presentation

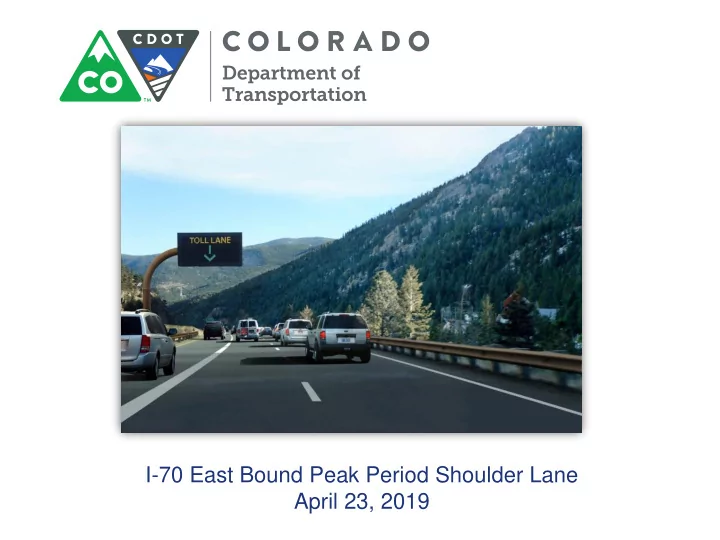
I-70 East Bound Peak Period Shoulder Lane April 23, 2019 Interstate 70-West of Denver Heavy Recreational Traffic on Weekends Travel from the City to the Mountains 30,000 ADTPeak Weekend Traffic 50,000+ Twelve Mile Bottleneck-


slide-1
SLIDE 1

I-70 East Bound Peak Period Shoulder Lane April 23, 2019

slide-2
SLIDE 2

Interstate 70-West of Denver

slide-3
SLIDE 3

Heavy Recreational Traffic on Weekends

slide-4
SLIDE 4

Travel from the City to the Mountains

  • 30,000 ADT—Peak Weekend Traffic 50,000+
  • Twelve Mile Bottleneck-
  • East Bound-US 40 from Winter Park and Grand County

feeds into I-70 at Empire Junction, which is carrying traffic from Vail and Summit County. Interstate remains two lanes

  • US 6 leaves Interstate at Floyd Hill, taking traffic to Golden

via Clear Creek Canyon. Interstate 70 increases to 3 EB lanes.

slide-5
SLIDE 5

Heavy Recreational Traffic on Weekends

slide-6
SLIDE 6

1950s US6 Junction versus 1960s US 6 Junction

slide-7
SLIDE 7

P.E.I.S.

PEIS restricts Infrastructure improvements in Clear Creek County. Mountainous Terrain makes expansion of Interstate very difficult

slide-8
SLIDE 8

Operational Improvements

Non-Infrastructure Operational Improvements-Allowed under PEIS 4’ Right S houlder 12’ General Purpose Lane 11’ Left General Purpose Lane 11’ Peak Period S houlder Lane 1’ S hy distance 39’ Total S ection Constructed with minimal additional pavement (Primarily Barrier, Retaining Walls) 41’ S ection in New WB Proj ect

slide-9
SLIDE 9

Tolling and Operating Protocols

  • Traffic and Revenue Study indicated that corridor would

support tolls from $4 to $30 for the 12 mile trip. Study showed expected “average” revenue to be $12 per user.

  • Initial plan was to invoke Dynamic Tolling, where tolls would

vary depending upon traffic volume and congestion levels.

  • Negotiated operating protocols with FHWA and Clear Creek
  • County. Initially limited to 73 days of operation per year (20%)
  • Expanded to 100 days in year 2.
  • Lane must be “swept” before opening. Generally, it’s opened

at 9:00 AM so sweeping can occur during low traffic.

slide-10
SLIDE 10

Tolling and Operating Protocols

  • Dynamic tolling was difficult to implement in real time.

Latency of the system was found to be slower than the dynamism of the traffic.

  • Toll rates were less elastic than expected. Usage dropped

precipitously when tolls were raised above $8.00.

  • Traffic demand varies for somewhat unpredictable reasons.
slide-11
SLIDE 11

Tolling and Operating Protocols

  • Seasonal Effects-
  • Summer peak lasts longer. Traffic has always been heavier

in summer.

  • Winter peak is tied to sunset and the ski areas closing at

4:00 PM.

  • Weather Effects-
  • “Powder Days” in winter—bad weather drives demand up.
  • “Rainy Days” in summer –bad weather drives demand

down-or makes people head home earlier in the day.

  • Unusual Events
  • Bronco Games-Home or away, competitive or not.
  • Special Events-X-Games in Aspen, World Cup Ski Races in

Vail-push peak later as those places are 1-2 hours west of lane.

  • Holidays.
slide-12
SLIDE 12

Current Process

  • Open lane at 9:00 AM on Saturday-with a toll of $4
  • Raise price to $5 at late morning
  • And $6 at 1:00 PM
  • Close lane at 6 PM, unless speclal conditions warrant keeping it
  • pen.
  • Sundays follow same pattern, just $1 dollar more expensive
  • Summer operation extends opening hours to 8 PM or

whenever traffic drops. Price increase generally occurs earlier in the day.

  • Real time traffic counter in Eisenhower Tunnel, 20 minutes

west of lane. This is used to determine when to close lane.

  • Lane capacity is about 800 cars per hour. Seldom sees that,

regardless of price. System capacity is about 3200 cars per hour.

slide-13
SLIDE 13

Performance

  • Massive improvement to non-toll lane traffic speeds.
slide-14
SLIDE 14

I-70 Mtn. Express Lanes – Findings

2014 Saturday Travel Times (Pre-MEXL) 2017 Saturday Travel Times 2014 Sunday Travel Times (Pre-MEXL) 2017 Sunday Travel Times

slide-15
SLIDE 15

Surprises

  • Price sensitivity inelastic-lane usage more a function of

perceived congestion, than price—until price raised above $8.

  • Revenue is growing as public acceptance grows.
  • Two peak days per week, with only a few peak hours per day,

limits revenue. Generates around $100k per month-with very

  • bvious seasonal impacts (summer and winter are better than

fall, which is better than spring. Sundays are better than Saturdays)

  • Even when traffic doesn’t warrant it, the lane is opened,

weather permitting most every weekend. A predictable

  • pening helps train the public. It doesn’t open during

blizzards.

  • The Yellow Left Shoulder Stripe helps compliance during non-
  • peration hours.
slide-16
SLIDE 16

Moving Forward

  • Construction of westbound lane to commence this summer.
  • Section slightly wider—both general purpose lanes are 12’, and

shy distance at median is 2’ rather than 1’.

  • Existing EB Median Shoulder will be used for construction of

WB—but EB Lane will continue to function on weekends.

  • We continue to explore real time dynamic pricing, but this

corridor’s predictable traffic patterns-and lack of alternate routes-limit the benefits of this approach.

slide-17
SLIDE 17

Questions?