
SLIDE 1
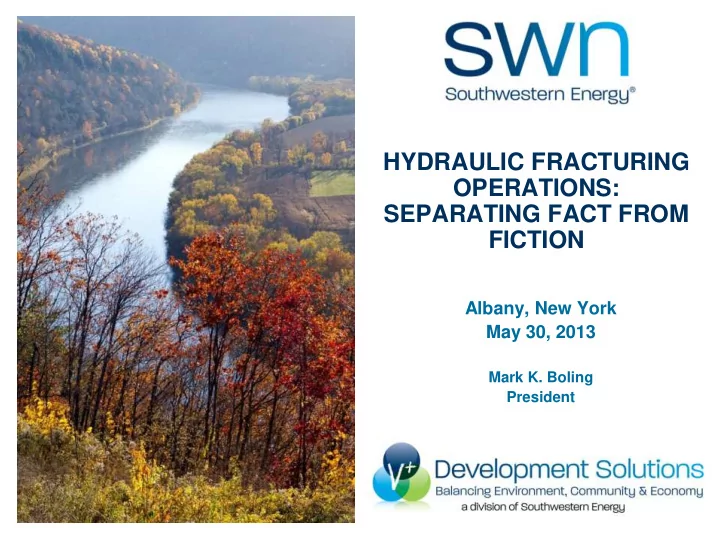
Albany, New York May 30, 2013
Mark K. Boling President
HYDRAULIC FRACTURING OPERATIONS: SEPARATING FACT FROM FICTION
HYDRAULIC FRACTURING OPERATIONS: SEPARATING FACT FROM FICTION - - PowerPoint PPT Presentation
HYDRAULIC FRACTURING OPERATIONS: SEPARATING FACT FROM FICTION Albany, New York May 30, 2013 Mark K. Boling President Regulatory Considerations Surface Considerations Subsurface Considerations 1 Surface Considerations Air Emissions
Albany, New York May 30, 2013
Mark K. Boling President
HYDRAULIC FRACTURING OPERATIONS: SEPARATING FACT FROM FICTION
1
2
Air Emissions Water Supply Water Handling Water Reuse & Disposal Surface Impact
3
Protecting Underground Water Resources Frac Fluid Disclosure
4
5
Well Construction Standards
Evaluate Stratigraphic Confinement
Evaluate Mechanical Integrity of Well
Monitor Frac Job & Producing Well
~2000’ - 3000’
Surface Casing 925’ 850’ Usable Fresh Water Various Upper Devonian Sands & Shales Tully Limestone Hamilton Group Shales Onondaga Limestone 100’ - 300’ Marcellus Shale
6 Cross sectional view
Virtually all fresh water wells are less than 850 feet deep in the Marcellus Shale area Thousands of feet of rock separates the Marcellus Shale from shallow, freshwater zones
Cross sectional view
~2000’ - 3000’
Surface Casing 925’ 850’ Usable Fresh Water Various Upper Devonian Sands & Shales Tully Limestone Hamilton Group Shales Onondaga Limestone 100’ - 300’ Marcellus Shale
7
target formation (Marcellus Shale) and surrounding formations (Hamilton Group Shales and Tully Limestone above, and Onondaga Limestone below) act to limit growth of the hydraulic fractures outside the target formation.
within the Marcellus Shale.
Hamilton Group Shales 100’ - 300’ Marcellus Shale Onondaga Limestone
Microseismic Evaluation of Stimulation Treatment
8 Cross Sectional View 1,000’
Subsea Depth
Top of Tully Limestone Well Path Top of Marcellus Shale Top of Onondaga Limestone
200’
The largest recorded seismic event generates the same amount of energy as would be released when dropping a gallon of milk from chest high to the floor.
~2000’ - 3000’
Surface Casing 925’ 850’ Usable Fresh Water Various Upper Devonian Sands & Shales Tully Limestone Hamilton Group Shales Onondaga Limestone 100’ - 300’ Marcellus Shale
Shallow Wells
9
1850’ 850’ Usable Fresh Water 100’ - 300’ Marcellus Shale 1000’ Middle-Upper Devonian Sands & Shales Abandoned Well Transmissive Fault
In most shallow formations (less than ~2,000’), the hydraulic fracture will propagate in a horizontal direction.
Cross sectional view
~2000’ - 3000’
Surface Casing 925’ 850’ Usable Fresh Water Various Upper Devonian Sands & Shales Tully Limestone Hamilton Group Shales Onondaga Limestone 100’ - 300’ Marcellus Shale
10 Cross sectional view
4000’
Surface Casing 550’
Cross sectional view
400’ Usable Fresh Water 2100’ Various Atoka Sands & Shales 1300’ Upper Hale 600’ Morrow Shale Hindsville 300’ Fayetteville Shale
FRESH WATER AQUIFER ZONE SHALLOW PRODUCING ZONE
WELL CONSTRUCTION STANDARDS
TARGET PRODUCING ZONE CONDUCTOR PIPE SURFACE CASING PRODUCTION CASING CEMENT CEMENT CEMENT
FRESH WATER AQUIFER ZONE SHALLOW PRODUCING ZONE CONDUCTOR PIPE SURFACE CASING INTERMEDIATE CASING
WELL CONSTRUCTION STANDARDS
TARGET PRODUCING ZONE CEMENT CEMENT
(New York Proposed Rules)
CEMENT PRODUCTION CASING CEMENT
– Verify appropriateness of proposed casing program (e.g., size, grade, minimum internal yield pressure, etc.) – Test casing string to ensure it can withstand maximum stimulation pressure
– Verify quality of cement – Identify top of cement – Test cement job (FIT, CBL, etc.) when operations indicate inadequate coverage
13
FRESH WATER AQUIFER ZONE SHALLOW PRODUCING ZONE CONDUCTOR PIPE SURFACE CASING PRODUCTION CASING TARGET PRODUCING ZONE
GOOD MECHANICAL INTEGRITY
FRESH WATER AQUIFER ZONE SHALLOW PRODUCING ZONE TARGET PRODUCING ZONE CEMENT CEMENT CEMENT CEMENT
GOOD MECHANICAL INTEGRITY
(New York Proposed Rules)
CONDUCTOR PIPE SURFACE CASING INTERMEDIATE CASING PRODUCTION CASING
CEMENT CHANNELING
PRESSURE BUILDS UP
CONDUCTOR PIPE SURFACE CASING PRODUCTION CASING FRESH WATER AQUIFER ZONE SHALLOW PRODUCING ZONE TARGET PRODUCING ZONE CASING CEMENT FORMATION
PSI 1,000 psi
FRESH WATER AQUIFER ZONE SHALLOW PRODUCING ZONE CONDUCTOR PIPE SURFACE CASING INTERMEDIATE CASING TARGET PRODUCING ZONE PRODUCTION CASING
CEMENT CHANNELING
PRESSURE BUILDS UP
CASING CEMENT FORMATION
(New York Proposed Rules)
18
19
Location, Rate & Timing of Withdrawals Cumulative Impact Assessment
19
Volumes Needed
20
Trucks vs. Pipeline
Impoundments vs. Tanks
Tracking Wastewater
Water Recycling & Reuse
Water Treatment Facilities
chemistry
(NORM, DBPs, heavy metals)
Water Disposal Wells
21
25,000’ IGNEOUS BASEMENT LIMESTONE SHALE
WATER DISPOSAL WELL WATER DISPOSAL WELL HORIZONTAL SHALE WELL SAND
The largest recorded seismic event generates the same amount of energy as would be released when dropping a gallon of milk from chest high to the floor.
EXISTING STRESS NEW STRESS 22
23
Reduction Technology
units, low bleed/no bleed pneumatic devices, plunger lift systems, leak detection
Emission Type
Emission Levels
24
Infrastructure
facilities
Truck Traffic & Road Damage Drilling Locations
sedimentation
25
26
Pad Drilling
PERCEIVED RISK ACTUAL RISK
INFORMATION GAP
27
ACTUAL RISK PERCEIVED RISK COLLABORATION AND RISK COMMUNICATION
SMART REGULATION PERCEIVED RISK ACTUAL RISK PUBLIC TRUST & ACCEPTANCE
ACTUAL RISK PERCEIVED RISK
SMART REGULATION PERCEIVED RISK ASSESSED RISK
COLLABORATION AND RISK COMMUNICATION
PUBLIC TRUST & ACCEPTANCE
Albany, New York May 30, 2013
Mark K. Boling President
HYDRAULIC FRACTURING OPERATIONS: SEPARATING FACT FROM FICTION