
SLIDE 1
Hurricane Tiered Evacuation Bruce Sterling Chief Regional - - PowerPoint PPT Presentation
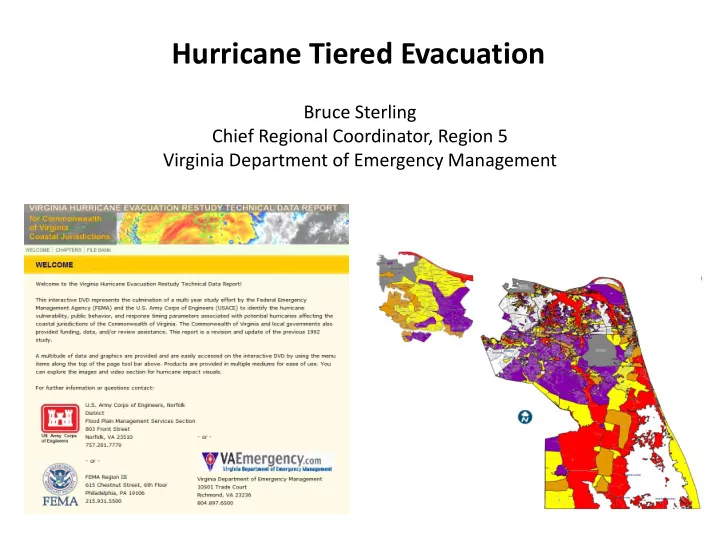
Hurricane Tiered Evacuation Bruce Sterling Chief Regional Coordinator, Region 5 Virginia Department of Emergency Management Methodology of Determining Hurricane Risk Historical Approach SLOSH Maximum of Maximums (MOM) for Cat 1-4
Storm Intensity Grouping Storm Track Directional Grouping P to N NNW to WNW Cat 1 - 2 Cat 3 Cat 4
Cat 1 Cat 2 Cat 3 Cat 4 NE NNE N NNW NW WNW
Cat 1 Cat 2 Cat 3 Cat 4 NE NNE N NNW NW WNW
Populations Impacted Zone A – 246,946 Zone B – 304,972 Zone C – 407,624 Zone A – 246,946 Zone D – 264,708 Zone A +B+C – 959,452 Zone A +B – 551,918 Zone A +B+C+D– 1,224,250 Cumulative Totals