SLIDE 1 manuscript No. (will be inserted by the editor)
Human Capital Investment and the Sustainability of Public Transfer Systems Across Europe
An Evaluation based on National Transfer Accounts
Bernhard Hammer · Alexia Prskawetz · R´
al · Lili Vargha · Tanja Isteniˇ c ·
Received: date / Accepted: date
Abstract We evaluate the sustainability of the public transfer systems in 24 EU countries using a new cohort-specific indicator, the Human Capital Investment Gap (HKIG). The indicator measures for a certain cohort the difference between the public benefits in old age and the public contributions of their children. Calculating the HKIG for the cohort born in 1950, we show that in none of the analyzed countries the contribution of the child generation will be sufficient to finance the old age benefits of the 1950 cohort, given the age- and employment-specific transfer pattern observed in 2010. This result holds for most of the countries even when assuming very optimistic employment
- scenarios. The decomposition of the HKIG into its components indicates that
the cross-country differences in the HKIG are mainly driven by the level of
This project has received funding from the European Unions Seventh Framework Pro- gramme for research, technological development and demonstration under grant agreement no 613247. Bernhard Hammer Wittgenstein Centre for Demography and Global Human Capital (IIASA, VID/¨ OAW, WU), Vienna, Austria Tel.: +43-1-313367728 E-mail: bernhard.hammer@oeaw.ac.at Alexia Prskawetz Wittgenstein Centre for Demography and Global Human Capital (IIASA, VID/¨ OAW, WU) and Institute of Statistics and Mathematical Methods in Economics, TU Wien, Vienna, Austria Lili Vargha Hungarian Demographic Research Institute, Budapest, Hungary and Doctoral School of Demography and Sociology, University of P´ ecs, P´ ecs, Hungary R´
al Hungarian Demographic Research Institute, Budapest, Hungary Tanja Isteniˇ c Faculty of Economics, University of Ljubljana, Ljubljana, Slovenia
SLIDE 2 2 Bernhard Hammer et al.
public contribution and benefits, while retirement age and employment rates play a comparably minor role. Keywords Public transfers · human capital · sustainability · National Transfer Accounts · generational contract 1 Introduction: Monitoring Public Transfers in Ageing Societies Population ageing goes hand in hand with fundamental changes in the life course and lifestyles of individuals. The most remarkable changes are higher levels of formal education, postponement of childbearing, a lower number of children, better health at all ages and a higher life expectancy. These changes affect the funding of the public transfer system, which constitutes largely a redistribution from the population in employment to the retired elderly.1 In- creasing life expectancy together with pension systems that are tied to fixed age borders has led to an extensive period of retirement, which resulted, in combination with declining fertility, in an increase in the number of retired persons relative to the size of younger generations. As a consequence of these developments the population in employment has to finance longer periods of economic dependency for an increasing number of persons. It is of utmost importance for individuals and policy makers to gain in- formation how demographic changes and the associated changes in individual behavior affect the public transfer system. Expectations about the level of taxes and the access to public transfer benefits in the future influence im- portant current economic decisions of individuals, such as how to provide for
- ld age. Inaccurate projections and unmet expectations can result in consid-
erable economic hardship and loss of personal welfare. Policy makers in turn are concerned that the changing demographic structure and macro-economic conditions result in a large burden on the young generations and limit the ca- pacity of the state in other areas, such as education and infrastructure spend-
- ing. These concerns are intensified with the progression of population ageing.
Several authors emphasize that it might be increasingly difficult to implement policy changes at the disadvantage of the large and growing group of elderly voters (e.g. Bovenberg, 2008; Sinn and Uebelmesser, 2003). The consequences of population ageing for the public transfer systems are therefore closely monitored. Remarkable efforts are made by the European Commission, which established the Working Group on Ageing Populations and Sustainability (AWG) to improve the quantitative assessment of the long- term sustainability of public finances and the economic consequences of ageing populations of the EU Member States. Results of the evaluation are published in the triannual Ageing Reports (e.g. European Commission, 2015). The eco- nomic and fiscal implications of ageing are also the topic of the Fiscal Sus- tainability Reports of the European Commission (e.g. European Commission,
1 Age-specific data on income, transfers, consumption and saving for 2010 are provided
- n http://www.wittgensteincentre.org/ntadata.
SLIDE 3 Human Capital and the Sustainability of Public Transfers 3
2016). Both, the Ageing Reports and the Fiscal Sustainability Reports include a range of indicators describing the consequences of ageing, in particular for the government budget. An important group of these indicators provides in- formation on the sustainability of the public transfer system, i.e. they measure the degree to which taxes and social contributions can finance public bene- fits in the future, given the expected demographic changes and the expected changes in age-specific public contributions and benefits. However, the commonly used sustainability indicators for the public trans- fer system do not account for the fundamental relation between transfers to children and the transfers to the retired elderly population over time. The gen- erosity of the public transfer system to the members of the elderly population relies on their investment in children when they themselves were in working
- age. These investments determine the ability of the generation of children to
finance public pensions and health services for the elderly once they enter em-
- ployment. In this paper, we develop a sustainability indicator for the public
transfer system using a framework that takes this fundamental relation be- tween transfers to children and the transfers to the elderly population into
- account. Our indicator contrasts the public net benefits that are expected by
the members of a certain cohort in old age with the projected public transfers to the elderly population that are made by the children of this cohort. We find for the cohort born in 1950 that in all of the analyzed countries the projected
- ld age benefits are considerably higher than the contributions of the chil-
- dren. The gap indicates insufficient investments in children, in terms of their
number, their education and integration into the labour force. This finding motivated the name human capital investment gap (HKIG) for our indicator. The decomposition of the HKIG into its components allows us to identify several characteristics of transfer systems that influence the sustainability of public transfers and the size of the HKIG. We find that the cross-country dif- ferences in the size of the HKIG are mainly driven by the per capita levels of contributions and benefits and only to a very limited degree by the number of years an average person is net contributor, respectively net beneficiary. In Chapter 2 we develop a framework for analyzing intergenerational trans- fers using the concept of a generational contract. The framework accounts for the relation between transfers to children and the transfers to the elderly pop-
- ulation. Chapter 3 provides an overview of indicators that are commonly used
for monitoring the sustainability of the public transfer system under demo- graphic change. We distinguish two groups of such indicators: indicators that are based on data from one period such as dependency ratios; indicators with a long-term time horizon that use data from several periods and take into account expected future tax payments and public expenditure. The chapter discusses advantages and shortcomings of these indicators and their relation- ship with the HKIG. Chapter 4 provides an overview of the intergenerational public transfer flows in 2010 using the European National Transfer Accounts data for 25 countries. These data serve as basis for calculating the HKIG for the cohort born in 1950, which is the topic of Chapter 5. The central elements
- f the HKIG are projections of the public old age benefits for the 1950 cohort
SLIDE 4 4 Bernhard Hammer et al.
and projections of the public contributions of their children. The projections account for likely increases in employment rates of the child generation at older ages, which is probably one of the most important changes in age-specific eco- nomic behaviour expected in the future. The results are presented in Chapter
- 6. We find a considerable gap between the projected old age benefits of the 1950
cohort and the transfers that are provided by the generation of their children in all the countries. Alternative scenarios of employment at older ages indicate that an increase in employment rates will not be sufficent to balance benefits in old age with the contributions of children. This result is reinforced by a decomposition of the HKIG into its components, which shows that the most important determinant of cross-country differences is the per capita level of benefits and contributions. Chapter 7 summarizes our findings and concludes. 2 The Generational Contract Characteristic for the human life course are two periods of economic depen- dency, childhood and old age. The principal intergenerational transfer flows are consequently from the working age population to children and to the retired elderly population. The transfers to the elderly population are in European countries mostly in the form of public transfers, while transfers to children are mainly organized by households (see e.g. G´ al et al., 2017). There is a re- lationship between the transfers to children, which are mostly private, and the predominantly public transfers to the elderly. For a generation to receive public transfers in old age it requires ”investments” in children in the first place, in terms of their number, their education but also their integration into the labour market and their equipment with capital. Without adequate in- vestments, the generation of children will be not be able to generate sufficient income to finance the public old age benefits of the generation of their par-
- ents. This relation seems obvious, but it is largely ignored in the organization
- f public transfers. Individual pension benefits, for example, are in most coun-
tries linked to the labour income during working life and not on the ability
- f the young generation to pay these transfers. Discussing the sustainability
- f the public transfer system requires a framework that takes the transfers to
the retired elderly population as well as the transfers to children into account. The reciprocal transfer flows between children and the generation of their parents can be described as a generational contract. A contract is defined as agreement with specific terms between two or more persons or entities in which there is a promise to do something in return for a valuable benefit known as consideration (Collins Dictionary of Law, 2006). The consideration is the promise made that induces the other party to enter the contract. We can re- gard the transfers from the parents as consideration for children: the parental generation provides resources for children until they are able to support them- selves and enter the labour force. The share of the income that is paid to the elderly population in form of public transfers, such as pensions and health care, is the consideration for the parents. A similar definition is for example used by
SLIDE 5 Human Capital and the Sustainability of Public Transfers 5
Whyte et al. (2008), who define the intergenerational contract as an implicit expectation that parents will care for their children until they can care for themselves, and children will support their parents when they can no longer support themselves. Their focus is on African countries, characterized by a
- nly marginal involvement of the public sector in intergenerational transfers.
However, the description of intergenerational transfers as a contract fits very well also to countries where the needs of the elderly population are financed through public transfers. Within the concept of the generational contract the intergenerational flows have to be described in terms of investments rather than transfers.2 The parental generation invests in the human capital of the society in form of children and their education and receives the returns to these investments in form of pensions, health care and long-term care. Because the term transfers is commonly used to describe flows between generations, we will use both, ”transfers to children” and ”investments into children” interchangeably. The conceptualization of intergenerational transfer flows in terms of a contract emphasizes the importance of investments in children in the form of having children, nurturing and educating them. These investments are the contribu- tion of the parental generation to the contract and a necessary element that enables and justifies the benefits received by the parental generation in re-
- tirement. One of the main questions regarding sustainability of public sector
transfers is, therefore, if these investments are, and have been, large enough to enable transfers to the elderly at the current level. This is exactly the question that is answered by calculating the HKIG. 3 Sustainability Indicators for the Public Transfer System Indicators in general are defined as operational representations of certain at- tributes of a system (Gallopin, 2005). Their ultimate aim is the improvement
- f decisions through the provision of relevant information. An important at-
tribute of the public transfer systems is sustainability. The exact definitions of sustainability in the context of public transfers differ, but all these definitions require that the public transfer system does not lead to ever-growing public debt levels in relation to GDP if the current rules that determine transfer benefits and contributions persist. In some contexts, financial sustainability may also require the complete or partial pay-off of currently existing debts. For a discussion and comparison of sustainability definitions see e.g. Langenus (2006). In this section, we give an overview of the wide range of indicators that are used to obtain insights into the consequences of ageing for the funding of the public sector. A comprehensive comparison of sustainability indicators is presented in G´ al and Monostori (2016). They distinguish indicators that are
2 A transfer is defined as a transaction in which one institutional unit provides a good,
service or asset to another unit without receiving from the latter any good, service or asset in return as a direct counterpart (SNA, 2009). Contracts, on the contrary, are agreements about mutual exchanges with well-described counterparts.
SLIDE 6 6 Bernhard Hammer et al.
based on data from one period and indicators with a long-time horizon, which sum up information over several periods in one indicator. 3.1 Cross-Sectional Indicators Important and widely used examples of cross-sectional indicators are dependency- and support ratios. Dependency ratios are built up by defining functions Dep(Xi) and Sup(Xi), which assign to each individual i a value for the degree
- f its dependency and its ability to support others. The exact value depends
- n individual characteristics Xi, such as age, gender, activity status or other
economic quantities such as income. Dependency ratios are calculated by sum- ming up the dependency measure and the support measure (i.e. the values of the Dep(Xi) and Sup(Xi) functions) over the whole population of N individu- als and by relating total dependency to total support. Support ratios are built up analogously, by relating total support to total dependency. DepRatio = ∑N
i=1 Dep(Xi)
∑N
i=1 Sup(Xi)
(1) For example, in a commonly used version of an economic dependency ratio the dependency measure Dep(Xi) takes the value of 1 if a person is not in employ- ment and 0 otherwise. The corresponding support measure Sup(Xi) takes the value of 1 if a person is employed and 0 otherwise. Consequently, this version
- f an economic dependency ratio measures the number of non-employed per-
sons per employed person. Several types of dependency ratios are compared in Loichinger et al. (2017). They show that the results depend very much on the definition of the indicators. Their findings suggest that general ageing indica- tors such as the demographic dependency ratio and the economic dependency ratio are of limited use for monitoring subsystems of the economy such as pub- lic transfers. However, there are some cross-section indicators focusing on the public sector. Miller (2011) and Goldstein and Kluge (2016) use a cross-section indicator to measure the emerging gap between public benefits and the public contributions in ageing populations, assuming the persistence of observed age
- patterns. Loichinger et al. (2017) and Miller (2011) present an indicator that
measures the extent to which the public system reallocates resources between
- generations. Cross-sectional indicators are undoubtedly easy to understand
and provide important information about demographic and economic devel-
- pments. However, their value per se tells little about the sustainability of the
public transfer system. 3.2 Indicators with a Long-Term Time Horizon The sustainability indicators with a long-term time horizon have an explicit focus on the public sector. They take into account that the promises of public benefits payable in the future constitute an implicit liability for the public
SLIDE 7 Human Capital and the Sustainability of Public Transfers 7
sector while the expected public revenues constitute an asset. Virtually all of the public sustainability indicators with a long-term time horizon measure the difference between the present value of total assets and liabilities. The indica- tors in this group are consequently closely related to each other. They differ mainly in the components of public transfers they focus on, the way of project- ing future benefits and contributions and the time horizon of the projections. Indicators accounting for implicit government liabilities are undoubtedly of high relevance: citizens have enormous interest in understanding if the state can fulfill its promises of future transfers, e.g. of pensions and health services. Below we present examples of indicators with a long-term time horizon that are used in the literature. A straightforward way to measure official and implicit government debt in a given year is the inter-temporal net worth (INW)
- indicator. It is for example used in the Fiscal Sustainability Report of the
European Commission (2016) and calculated as the present value of future primary balances (assuming the perpetuation of current fiscal policies and rules) less the value of current net assets of the government. The INW can be interpreted as a measure of government’s net financial wealth, taking into account the projected implicit future liabilities due to ageing. The concept of the INW is used in an identical or very similar form under different names, such as the true government debt (Raffelh¨ uschen, 1999), the intertemporal public liabilities (Raffelh¨ uschen and Gokhale, 2000), the intertemporal budget gap (Cardarelli et al., 2000) and the sustainability gap (Bonin and Raffelh¨ uschen, 1999). Several indicators measure government debt in an indirect way. Blanchard (1990) and Blanchard et al. (1990) developed the concept of a tax gap. They define the tax gap as the difference between the sustainable tax rate – the tax rate that would leave the debt to GNP ratio unchanged under current fiscal rules – and the current tax rate. The tax gap is calculated for short term (a year), medium term (5 years) and a long-term (40 years) horizon. Other indicators are the S1 and S2 indicators applied in European Commission (2016). The S1 indicator measures the required adjustment in the primary balance of the public budget for achieving a 60 percent public debt-to-GDP ratio by 2030. The very long-term fiscal sustainability is evaluated using the S2 indicator. It measures the required adjustment in the primary balance to stabilize the debt-to-GDP ratio over the infinite time horizon, and no explicit criteria on the debt-to-GDP level is set. Generational Accounting is a method that is used to generate a family
- f sustainability indicators with a long-time horizon (Auerbach et al., 1991;
Bonin, 2001). This method breaks down public contributions and benefits by
- age. By projecting the age-specific values into the future, estimates of public
contributions and benefits over the remaining lifetime are derived for members
- f currently living as well as future cohorts. Generational accounts (GAs) are
the differences between the present value of public contributions expected to be paid by the members of a generation throughout their remaining lifetime and the present value of the public benefits they receive. While contributions (taxes) and benefits for the living generations are calculated using the current
SLIDE 8 8 Bernhard Hammer et al.
rules, the tax rate of future generations is calculated by assuming that they bear current debt as well as all potential future deficits. The generational im- balance (GI) indicator is derived by comparing the GAs of the newborn with that of future generations. It measures how much the future generations have to contribute in relation to their benefits compared to the generations that pay taxes and receive benefits under the current rules. The current organization of public transfers is sustainable if the GI is small. A point of criticism of gener- ational accounting is that the distribution of liabilities between generations is actually an assumption. A large GI carries not much more information than that the current system is not sustainable. Such information is also provided by simply calculating implicit tax rates for the whole population. In general, GAs and the family of indicators with a long-term time horizon have several disadvantages. Although the basic concept is straightforward and understandable, the exact value is hard to interpret. One of the reasons is the application of rather arbitrary discount rates to calculate the present values. The actual value of these indicators is also very sensitive with respect to the initial situation and required assumptions. Nevertheless, these indicators can be useful instruments in the evaluation and comparison of policy reform sce- narios, where the relative value and the change of the value is more relevant than the absolute value. 3.3 The HKIG in the Family of Sustainability Indicators We want to emphasize that the indicators of long time-term time horizon are not designed to make predictions about the future, but rather provide infor- mation and signals about current developments and potential future tensions. Most of the public transfer projections, which are required for calculating the indicators, combine the current age pattern of public transfers with the fu- ture changes in the age composition. There are two fundamental problems with such an approach. First, the approach of keeping current age-specific val- ues constant ignores changes in behaviour associated with population ageing. Some of these developments, e.g. higher education and better health, could reduce the pressure for the government budget even under the assumption of persisting current rules. Growing levels of education and improving health con- ditions are associated not only with longevity but also with higher employment rates (e.g. Loichinger and Prskawetz, 2017) and consequently with higher taxes and lower benefits. Second, most sustainability indicators treat demographic changes as developments that are exogenous to the transfer system. However, demographic changes, in particular the fertility rates, reflect to a large degree changes in the transfers to children. These transfers, or better, investments, create the human capital that is required to generate the income and public revenues that enable and secure the transfer-based old age provision through the public sector. With the HKIG we want to overcome these weaknesses. The combination
- f employment projections with age- and employment-specific information on
SLIDE 9 Human Capital and the Sustainability of Public Transfers 9
public transfers allows a rather simple projection of future contributions and benefits, which takes the likely changes in employment rates into account. Fur- thermore, the HKIG contrasts the present value of the public old age benefits
- f a certain cohort with the contributions of their children. Thereby it takes
into account the fundamental relation between the generosity of the public transfer system to the elderly and their human capital investments into the generation of children. 4 Data: Public Transfers in National Transfer Accounts The HKIG indicator presented in this paper is based on data from the Eu- ropean National Transfer Accounts (NTA) data with base year 2010. NTA measure for a given year the age-specific averages of labour- and asset income, the redistribution of income between age groups through transfers and the age-specific use of disposable income for consumption and saving. NTA con- stitute an extension of the System of National Accounts (SNA): the aggregate values, i.e. the sum over the whole population, of income, consumption, sav- ing, public transfer payments and benefits are consistent with the values in the
- SNA. The European NTA dataset and the methodology is described in detail
in Isteniˇ c et al. (2016), following the NTA manual by UN (2013). It contains NTA for all European countries except Croatia, Malta and the Netherlands.3 In our analysis we also exclude the UK. The calculation of the HKIG relies on employment projections. However, such projections could not be generated for the UK, because of inconsistencies between the education-specific population projections and the labour force survey. 4.1 Components of Public Transfers Our analysis and the calculation of the HKIG indicator uses the detailed age- specific information on the different types of public transfer flows in the NTA. We use the term public contributions for the transfer flows from individuals to the public sector and public benefits for the flows from the public sector to individuals.4 Age-specific public contributions and benefits are used to de- fine the different life stages: childhood and old age are characterized by the age-specific averages of public benefits exceeding contributions, working age by contributions exceeding the benefits. With the term net public transfers we refer to the difference between public benefits and public contributions. The net public transfers are positive in childhood and old age and negative during working age. The term public net benefits refers to the positive net
3 General information about NTA can be found on the webpage of the global NTA project
at www.ntaccounts.org and in Lee and Mason (2011).
4 In NTA all flows are assigned to individuals dependent on their age. NTA distinguish
- nly two sectors: the government and the private sector, which includes households, corpo-
rations and non-profit organisations serving households.
SLIDE 10 10 Bernhard Hammer et al.
transfers in childhood and old age. Net public contributions refer to the public contributions less the benefits (=negative net transfers) of the working age population. Public contributions consist mainly of taxes and social contributions and are distinguished by the source, such as labour income, transfer income, asset income and consumption. Public benefits consist of in-kind transfers in form of public consumption and cash transfers. A large part of public in-kind transfers cannot be assigned to certain individuals or age groups, such as expenditure for internal security, defense or general administration. In this case, it is as- sumed that each person consumes the same amount, independent of their age. Individual public consumption as well as cash benefits are assigned to the age group that benefits from these transfers. NTA make a further distinction by the main purpose and function of public benefits: the most important components
- f individual public consumption are education and health services; the most
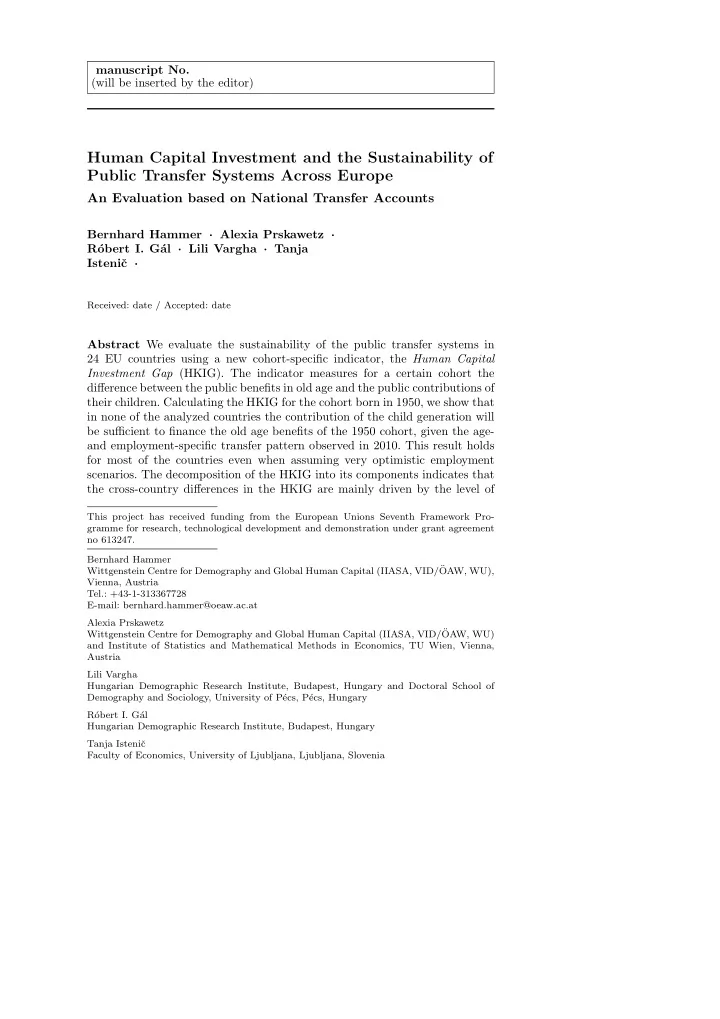
important components of public cash transfers to individuals are pensions, followed by unemployment benefits and family and child benefits. The general age pattern of net public transfers is illustrated in Figure 1, which plots the age averages for 24 European countries (weighted with age- specific population size) and the age averages for the three most populated countries in our analysis, Germany, France and Italy. To make these flows comparable, the net transfers are measured as a share of the average labour income of a full-time worker (YLFT) in each country. The number of full time workers is estimated using the LFS by dividing the estimate of total weekly working hours in the economy with 40. This standardization eliminates dif- ferences in the level of hourly labour income across countries, but accounts for differences in employment rates. Two countries with similar levels of pro- ductivity per working hour and similar tax rates would be different regarding the levels of transfers when measured in terms of YLFT, being higher in the country with the higher employment rates. This is important in projections, as increasing employment supports the sustainability of the public transfer
- system. The basic age-specific transfer pattern is similar across countries. Net
public transfers are positive at young age until about age 23. The comparably small consumption taxes are the only flow from children to the public sector, whereas children receive rather expensive education services through the pub- lic sector. Net transfers are negative during working age when individuals pay social contributions and taxes on their labour income, but receive little ben- efits from the public sector. In old age (from about age 60 onwards) average net public transfers are again positive as retired persons do not have labour income but receive public pensions, health care and long-term care services.
SLIDE 11 Human Capital and the Sustainability of Public Transfers 11
−.3 −.2 −.1 .1 .2 .3 .4 Net public transfers relative to the labour income of a full−time worker 20 40 60 80 Age European Average (24 countries) Germany France Italy
Source: www.wittgensteincentre.org/ntadata
- Fig. 1 Net public transfers by age in 2010: European Average, Germany, France and Italy
4.1.1 Aggregate Net Public Transfers Between Generations By multiplying the age-specific averages of net public contributions and net benefits with the corresponding populations, we get estimates for the total net flows between age groups in the year 2010, reported in Table 1. All these aggregate quantities are measured as percentage of total labour income in the
- economy. Column 1 reports the net public contributions of the working age
- population. These contributions corresponded to 8.7 percent of total labour
income in Ireland, 11.7 percent in Slovakia, and more than 30 percent in Lux- embourg and Italy. The low values in Slovakia and Ireland are most likely a consequence of the economic crisis; in 2010 the public sector in both countries financed a large part of transfer benefits through dissaving and an increase of government debt (Column 2). Some of the public contributions are not directly used for the own population but transferred to the rest of the world, mostly in the form of EU-taxes. For completeness, these values are reported in Column
- 3. The sum of net contributions of the working age population, asset-based re-
allocations, which are defined as asset income less saving, and the net transfers from the ROW correspond to the amount of the net public benefits of children and the elderly in Column 4. Total benefits in childhood and old age corre- spond to less than 20 percent of total labour income in Bulgaria and about 30 percent in Lithuania, the values for the other countries lying in between. Of the total net public benefits between 40.4 percent in Luxembourg and 78.1 percent in Greece are directed to the elderly (Column 5). Column 6 shows the amount of net benefits to the elderly in terms of total labour income. It ranges between about 10 percent in Cyprus, Ireland and Luxembourg to around 20 percent in Italy and Finland and more than 25 percent in Greece.
SLIDE 12 12 Bernhard Hammer et al. Table 1 Intergenerational Net public transfers in Percent of Total Labour Income (1) (2) (3) (4) (5) (6) Net Asset Net Net Net benefits Net benefits contrib. income transfers benefits
working less from young & total net labour Country age saving ROW
benefits income Austria (AT) 28.2 0.9
27.6 68.3 18.9 Belgium (BE) 26.0 1.7
25.9 56.3 14.6 Bulgaria (BG) 18.4 2.6
19.8 68.5 13.6 Cyprus (CY) 23.9 0.8
24.2 45.2 10.9 Czechia (CZ) 20.7 8.8
28.5 62.5 17.8 Germany (DE) 22.2 0.7
21.5 68.2 14.7 Denmark (DK) 21.9 3.3
21.8 53.6 11.7 Estonia (EE) 23.3 2.7 0.2 26.2 61.6 16.1 Greece (EL) 21.5 12.3
32.5 81.6 26.5 Spain (ES) 15.3 9.3
23.5 62.0 14.6 Finland (FI) 21.9 9.2
29.0 68.5 19.9 France (FR) 22.2 8.1
28.2 61.7 17.4 Hungary (HU) 23.4 5.3
28.0 64.4 18.1 Ireland (IE) 8.7 15.2
21.7 47.8 10.4 Italy (IT) 30.2 0.3
28.9 68.4 19.8 Lithuania (LT) 16.1 13.9 0.3 30.2 57.4 17.3 Luxembourg (LU) 30.6
1.1 27.4 40.4 11.1 Latvia (LV) 13.1 13.2 0.8 27.1 59.0 16.0 Poland (PL) 20.8 7.3
26.7 63.8 17.0 Portugal (PT) 15.0 11.7
25.5 63.0 16.1 Romania (RO) 18.0 5.1 1.2 24.4 74.5 18.2 Sweden (SE) 25.7 0.9
24.0 58.6 14.1 Slovenia (SI) 22.9 3.7
25.7 64.4 16.6 Slovakia (SK) 11.7 13.2 0.8 25.7 65.3 16.8 Average (Avg.) 20.9 6.1
26.0 61.9 16.2 Source: Authors’ own calculations based on the European NTA database, Isteniˇ c et al. (2016) Available on: http://www.wittgensteincentre.org/ntadata (accessed: August 14, 2017)
5 Methodology: Calculating The Human Capital Investment Gap The HKIG measures the difference between the values of total net public ben- efits that a certain cohort is projected to receive in old age and the projected net contributions of its children’s generation over their entire working life. The values are measured in per capita terms, i.e. as average over all cohort mem-
- bers. In this paper we calculate the HKIG for the cohort which was born in
1950 and who turned 60 in the year 2010. The concept is illustrated in Figure 2 in a Lexis-diagram. It shows the intergenerational transfer flows between the 1950 cohort, the generation of its parents (referred to as parental gen- eration) and the generation of its children (referred to as child generation). The different generations are represented by the three diagonal lines, which relate time on the x-axis to the corresponding age and life-stage on the y-axis. Note, that we simplify the graph by representing the parental and the child generation as lines, although the children of the 1950 cohort are spread over a wide range of different cohorts. The major intergenerational transfer flows and their direction are illustrated with arrows. Members of the 1950 cohort
SLIDE 13 Human Capital and the Sustainability of Public Transfers 13
received transfers from the parental generation during their childhood, repre- sented by the yellow downward arrow on the left. The returns to these human capital investments were the transfers from the 1950 cohort to the parental generation during the working age of the 1950 cohort, represented by the blue upward arrow. This pattern of mutual exchange between generations holds as well for the successive generations: during working age the members of the 1950 cohort invested in their own children (blue downward arrow). During retirement, which started around 2010 at age 60, the members of the 1950 co- hort receive the returns to their human capital investments in form of public transfers from the child generation. However, given the current tax rates and the size of the child generation, these transfers might be insufficient to finance the public benefits that are expected by the members of the 1950 cohort. The pensions, which are the most important part of public transfers to the elderly population, are based on individual labour income, not on the investments in children and the children’s ability to pay for these pensions. The difference between total old age net benefits that are expected by a member of the 1950 cohort and the contributions of the children per 1950 cohort member repre- sents the HKIG of the 1950 cohort.5 In Figure 2 the HKIG is illustrated with the arrow split in two parts, representing the gap between old age benefits and the contributions of the child generation.
Age
working age childhood
Time 1950 1980 2010
The HKIG measures the difference between the expected public benefits of the 1950 cohort in old age and the expected public contributions of the child generation.
- Fig. 2 The concept of the HKIG for the 1950 cohort
For calculating the HKIG we adopt a cohort perspective and follow the 1950 cohort over old age and the child generation over working life. However,
5 The contributions of children per member of the 1950 cohort are calculated by dividing
the total contributions of the child generation by the number of the 1950 cohort members. Alternatively, it can be calculated by multiplying the net public contribution of a member
- f the child generation with the average number of children per member of the 1950 cohort.
SLIDE 14 14 Bernhard Hammer et al.
what we observe are only the flows in 2010. We therefore rely on simulations to project the public old age benefits that are expected by an average member
- f the 1950 cohort and the contributions of a member of the child generation.
To make the transfer flows comparable over time and countries, we measure all quantities in per capita terms relative to the average labour income of a full time worker (YLFT). As described before, the YLFT is calculated by dividing total labour income in the economy with the number of workers in full-time
- equivalents. For example, a person working 40 hours is regarded as one worker
in full-time equivalents, a person working 20 hours represents 0.5 worker in full-time equivalents. The public old age benefits of a member of the 1950 cohort are projected by assuming that the age-specific net public benefits per capita correspond to the age-specific averages we observe in the cross- section data of 2010. The average net contributions paid by a member of the child generation are simulated by assuming that age- and employment-specific averages of public contributions and benefits per capita remain constant at the level observed in 2010. For calculating the per capita life-time values, i.e. a person’s total net benefits in old age and the total net contributions over working life, we add up the values at each age. Projections and the calculation
- f the HKIG are described in detail in the rest of this chapter.
5.1 Public Benefits in Old Age For projecting the net public benefits of the 1950 cohort in old age, we assume that the age-specific net benefits per capita correspond to those observed in the NTA cross-section data from 2010. The total net public benefits that an average member of the 1950 cohort receives in old age (TGOAc1950, where TGOA stands for Transfers Government Old Age), is calculated by summing up the age-specific per capita values of net public benefits (TGi), multiplied with the corresponding survival probabilities Sc1950,i. The index i represents the age groups with positive net transfers in old age up to age 100. For i until age 80 we take the age-specific values of public transfers from NTA
- 2010. For older age groups we use TG80 as an approximation, because 80 is
the highest age NTA data are calculated for. The survival probabilities are calculated using the no migration variant of the Eurostat EUROPOP2013 population projections. Sc1950,i in Equation 2 denotes the probability of a member of the 1950 cohort to survive until age i for all ages until i = 99 and the expected number of years living beyond 100 for i = 100. Index i starts at age u, representing the youngest age group at old age for which public transfer benefits exceed contributions. This is usually around age 60, but differs across countries. TGOAc1950 =
100
∑
i=u
TGi ∗ Sc1950,i (2) Our assumption that the age-specific net public benefits in terms of YLFT for the 1950 cohort correspond to the cross-section age patterns observed in
SLIDE 15 Human Capital and the Sustainability of Public Transfers 15
2010 can be certainly justified for pensions, the largest part of public old age
- benefits. The pension level as share of YLFT remains rather constant once a
person is retired. This pattern is also found in the pension age profiles of the NTA 2010 data. The assumption that the age pattern corresponds to the 2010 cross-section age profile is more difficult to defend in the case of public health benefits, as it is not clear how age-specific health expenditure is affected by improving health and longevity. Some authors find evidence for the so called ”red herring hypothesis”, which states that health expenditure is less driven by age than by mortality and the proximity to death (e.g. Zweifel et al., 2004; Seshamani and Gray, 2004). In this case, the age-specific values would change with mortality. Longevity would lead to a ”flattening” of the public benefits age profile, i.e. to a slight reduction of the level and a shift of the peak towards higher ages. However, although public health benefits increase with age until about 80, they are found to stay rather constant after this age, despite huge increases in mortality (European Commission, 2015). We therefore regard the use of the 2010 cross-section age pattern for the simulations of the cohort values as a reasonable choice. 5.2 Public Contributions in Working Life For the second part of the HKIG indicator, we simulate the net public con- tributions to the elderly population that are paid by the children of the 1950 cohort throughout their working life. Of interest are the net contributions of the child generation per member of the 1950 cohort. In a first step we project the net contributions per member of the child generation. To simplify the cal- culations, we assume that the age-specific transfer pattern of a person born in 1980 is representative for the average child of the 1950 cohort. We keep age- and employment-specific contributions and benefits as share of YLFT constant at the level observed in 2010. However, we take into account that the age-specific employment rates and consequently the net public transfers of the 1980 cohort are likely to be higher, compared to the 1950 cohort and the 2010 cross-section data. The reason are changing characteristics of cohorts and gen- erations, such as the increasing educational attainment and better health. To account for these changes in our projections of public transfers, we calculate age-specific public contributions and benefits in 2010 by employment status and combine them with the employment projections. We use three alternative scenarios of employment rates for the child generation to test the sensitivity and importance of the employment assumption. NTA 2010 by Employment Status For the calculation of employment-specific NTA, we distinguish public contributions and benefits according to the em- ployment status of the group that is targeted. Public contributions are divided into three groups: taxes and social contributions paid by employed persons (TGOEMPL, where TGO stands for Transfer Government Outflows), taxes and social contributions paid by the non-employed population (TGONEMPL,
SLIDE 16 16 Bernhard Hammer et al.
e.g. taxes paid on pension benefits) and taxes that are independent of em- ployment status (TGOALL). The public benefits are distinguished into those that are directed to the population independent of the employment status (TGIALL, TGI stands for Transfer Government Inflows) and the benefits di- rected to non-employed persons (TGINEMPL). The first group among the benefits, TGIALL, includes public consumption other than education as well as cash transfers in the category of family and children. Transfers directed to the non-employed population, TGINEMPL, include public expenditure on education, pensions, disability benefits and unemployment benefits. The dis- tinction is not always clear-cut: some components of public consumption other than education (e.g. in-kind services for unemployed persons) as well as com- ponents of the cash transfers in the category family and children are actu- ally directed to non-employed persons.6 However, these are comparable small amounts and even from the micro data sources it is not always possible to distinguish different types of transfers within the same category. Note that we identify the transfers according to group that is targeted (employed, non- employed, all), but that at this point we still work with age-specific per capita
- averages. These averages measure the transfers related to employment and
non-employment that an average person at each age receives and pays. We then use the generated age profiles of public transfers and the pop- ulation numbers (POPj) to calculate the total (i.e. total economy) amounts
- f the public transfer components in 5-year age groups. The aggregation to
5-year age groups, represented by the index j, is necessary, because the em- ployment projections are not available on a more detailed level. Thereby we
- btain age-specific estimates of the total transfers that are paid and received
by the employed and non-employed population, respectively. The age-specific aggregate quantities that are assigned to the employed population are then divided by the number of employed persons (EMPLj) in the respective age
- group. Likewise, the age-specific quantities assigned to the non-employed pop-
ulation are divided by the number of non-employed persons (NEMPLj). By that we obtain average values of the employment-specific public contributions and benefits by age and by employment status (the first term in Equation 3, 4 and 6). Of the transfers that are not directly dependent on employment sta- tus we calculate 5-year age-averages, independent of employment status. We then derive age-specific estimates of public contributions for employed per- sons (TGOempl,j) and non-employed persons (TGOnempl,j) by summing up the corresponding employment-specific part of the contributions and the part independent of employment status. For benefits, likewise, we get age-specific estimates for employed (TGI empl,j) and non-employed persons (TGI nempl,j): TGOempl,j = TGOEMPLj ∗ POPj EMPLj + TGOALLj (3)
6 In some countries child benefits are paid to compensate caregivers for the loss of labour
income due to the absence from the job while they are taking care of their young children.
SLIDE 17 Human Capital and the Sustainability of Public Transfers 17
TGOnempl,j = TGONEMPLj ∗ POPj NEMPLj + TGOALLj (4) TGIempl,j = TGIALLj (5) TGInempl,j = TGINEMPLj ∗ POPj NEMPLj + TGIALLj (6) Combining Employment-Specific NTA with Employment Projections To derive the results for the 1980 cohort we first calculate estimates of the age-specific public benefits and contributions per capita for each year from 1995 to 2050 in 5-year steps by combining the age- and employment-specific transfer esti- mates with year- and age-specific projections of employment rates (EMPLh,j). The index h represents the year and j the age. Since we are interested in working age, j only takes values from age 15 to age 70. The employment pro- jections are taken from Hammer et al. (2016). These projections are based
- n education-specific trends observed in the past (Source: European Labour
Force Survey) and population projections by education (Wittgenstein Centre for Demography and Global Human Capital, 2015). Thereby we obtain age- and year-specific estimates of public contributions and benefits for the years from 1995 up to 2050 and age 15 to 70 in 5-year steps. TGOh,j = TGOempl,j ∗ EMPLh,j + TGOnempl,j ∗ (1 − EMPLh,j) (7) TGI h,j = TGI empl,j ∗ EMPLh,j + TGI nempl,j ∗ (1 − EMPLh,j) (8) From these data we can extract the total values of contribution and benefits for an average member of the cohort born in 1980 in 5-year steps. We denote the public contributions at age k with TGOk and the benefits with TGI k. The first estimate is from year 1995 at age k = 15, the last estimate from year 2050 at age k = 70. TGOk = TGO1980+k,k (9) TGI k = TGI 1980+k,k (10) The distinction between childhood, working age and old age requires esti- mates for the net transfers in single year age groups to determine the period with positive net contributions. For this purpose we assume the 5-year aver- ages for the mid of the age groups and use a linear interpolation for the ages in between. By summing up the net contributions at each age during working life, i.e. when net contributions are positive, we get the life time net public con- tributions of a member of the cohort born in 1980. Additionally, we adjust for survival probability (Sk, probability of a person born in 1980 to survive until age k) to obtain the expected life time net public contributions (TGWAc1980, with TGWA standing for Net Transfer Government during Working Age). The index l represents the lowest age when the net contributions are positive, and u − 1 the highest age with positive net contributions.
SLIDE 18 18 Bernhard Hammer et al.
TGWAc1980 =
u−1
∑
k=l
(TGOk − TGI k) ∗ Sk (11) To derive the net public contributions of the child generation per member
- f the 1950 cohort, we multiply the public contributions per member of the
child generation, TGWAc1980, with the number of children of the 1950 cohort7 an divide it by the size of the 1950 cohort. Of interest are not the total public contributions made by the child generation, but the transfers directed to the elderly (part of the contributions is used for children, such as public education). We therefore adjust additionally for the share of transfers directed to the elderly population (Column 5 in Table 1). Thereby we get the required input for calculating the HKIG, projections of the net public contributions that will be paid to elderly population by the children of the 1950 cohort, measured as average per member of the 1950 cohort. 5.3 Alternative Scenarios In almost all countries there are discussions about reforming the pension sys- tem and increasing retirement age. Increasing employment rates among older persons are seen as one of the main instruments to adjust the transfer systems to ageing populations. We analyse the effect of such an increase by calculat- ing the contributions of the child generation and the HKIG under different employment scenarios. The baseline scenario are the employment projections
- f Hammer et al. (2016), assuming a moderate increase based on the trends
- bserved in the last two decades. Additionally we calculate a minimum em-
ployment scenario using the age-specific employment rates in 2010 and a max- imum employment scenario assuming retirement at age 70. In the minimum employment scenario, we assume that age-specific employment rates of the 1980 cohort correspond to those observed in the 2010 cross-section data. We regard this as minimum employment scenario, as the trends go in the direc- tion of higher employment, especially in older age groups. In the maximum employment scenario we assume that the employment rates in the age group 60-64 and 65-69 will be at levels observed for the age group 50-55 in 2010. We compare the lifetime net contributions of the child generation and its effect
- n the HKIG under these scenarios. We use different scenarios for the con-
tributions but not for the benefits. There is room for changes in employment rates and the contributions of the child cohort at older ages. Persons born in 1980 were in 2010 merely at the beginning of their career and their working
- life. The members of the 1950 cohort in turn were in 2010 retired already or
shortly before retirement. There are no realistic employment scenarios that
7 The number of children is calculated using data on completed cohort fertility.
Source: Human Fertility Database. Max Planck Institute for Demographic Research (Ger- many) and Vienna Institute of Demography (Austria). Available at www.humanfertility.org (data downloaded 4 November 2016). For countries not included in the Human Fertility Database we use the total fertility rates in 1980 from EUROSTAT.
SLIDE 19 Human Capital and the Sustainability of Public Transfers 19
could alter significantly the amount of benefits they are expected to receive in
6 The Human Capital Investment Gap Across Europe A positive HKIG is a sign that the system is not sustainable and requires ad- justments, either through increasing the contributions of the child generation,
- r through decreasing the benefits of the parental generation or through net
- migration. Table 2 shows the results of our calculations. The values of net
public benefits in old age that can be expected by a person born in 1950 are listed in Column 1. The simple average over all countries (not weighted with population size) is 7.7 YLFT and ranges from less than 5 YLFT in Bulgaria to more than 10 YLFT in Finland and Greece. This means that in Finland and Greece it requires ten year of production of a full time employed worker to finance the net public benefits of an elderly person. The net contribution
- f the child generation is lower in all countries, at least under the baseline
- scenario. Column 2 shows our estimates for the average contribution of the
child generation per member of the 1950 cohort. The values range from 2.3 YLFT in Ireland to more than 6 YLFT in Austria and Italy. The HKIG (Col- umn 3) is the difference between the projected net benefits received by the 1950 cohort and the projected net contributions paid by the child generation, calculated as average per member of the 1950 cohort. The highest HKIG is
- bserved in Slovakia and Greece, where the government financed a large part
- f public benefits through public dissaving, which translates into a high share
- f benefits relative to contributions and consequently into a high HKIG. The
lowest HKIG is observed for Bulgaria, a country where the net public benefits in relation to YLFT are extremely low. Italy is the country with the second lowest HKIG, it is characterized by a high level of net contributions of the working age population and a moderate level of benefits for the elderly. The contributions of the child generation are considerably lower under the minimum employment scenario, the corresponding values of the HKIG are consequently higher. This result emphasizes once more the unsustainability of the current levels and age-patterns of public transfer systems across Europe. An interesting case is Greece, where the contribution of the child generation would even increase in the minimum scenario. These results can be explained with the decline in employment rates during the period 2001-2014, which serves as basis for the employment projections. This translates into a pessimistic projection of employment rates. Under the maximum employment scenario the corresponding values of the HKIG are still positive in all of the countries. However, the values of the HKIG are much lower compared to the first two scenarios, in Italy the increase in employment rates would be sufficient to balance benefits of the elderly and the contribution of the child generation. Increasing retirement age is clearly a powerful instrument to adapt the public transfer systems to ageing pop-
- ulations. But an increase in employment rates of the elderly alone will not
SLIDE 20 20 Bernhard Hammer et al. Table 2 The HKIG across Europe: Three Scenarios
Basic empl. Minimum empl. Maximum empl. scenario scenario scenario Contri- Contri- Contri- Benefits bution bution bution Country
children HKIG children HKIG children HKIG AT 10.0 6.4 3.6 5.7 4.3 8.2 1.8 BE 5.8 4.0 1.8 3.0 2.8 5.4 0.5 BG 4.7 4.1 0.7 3.9 0.8 4.4 0.3 CY 8.4 4.7 3.8 4.7 3.7 5.7 2.8 CZ 9.8 5.1 4.7 4.6 5.3 6.3 3.6 DE 6.7 4.8 1.9 3.9 2.8 5.5 1.2 DK 6.4 3.1 3.4 2.7 3.7 3.8 2.7 EE 7.2 5.0 2.2 4.7 2.5 5.8 1.4 EL 11.5 4.7 6.8 5.6 5.9 5.9 5.6 ES 7.0 3.0 4.0 2.6 4.4 3.6 3.3 FI 10.4 4.9 5.5 4.3 6.1 5.6 4.7 FR 8.3 5.2 3.1 4.1 4.2 6.8 1.4 HU 6.2 4.7 1.4 3.8 2.4 5.8 0.4 IE 6.5 2.3 4.2 1.5 5.0 2.8 3.7 IT 7.2 6.1 1.1 5.0 2.2 7.5
LT 5.9 2.6 3.3 2.4 3.5 3.0 2.9 LU 7.3 2.9 4.4 2.4 4.8 4.3 3.0 LV 5.8 2.9 2.9 2.4 3.3 3.2 2.5 PL 8.9 4.8 4.2 4.1 4.8 5.7 3.3 PT 7.6 3.1 4.5 3.1 4.5 4.1 3.5 RO 6.5 4.8 1.7 4.2 2.3 5.6 0.9 SE 7.8 5.7 2.1 5.0 2.8 6.8 1.0 SI 8.9 4.2 4.8 3.8 5.1 5.6 3.3 SK 9.5 3.2 6.3 2.7 6.8 3.7 5.8 Avg. 7.7 4.3 3.4 3.8 3.9 5.2 2.5 Source: Authors’ own calculations.
be sufficient to balance contributions and benefits in most of the countries. We conclude that in most European countries the public transfer system is adapted to large cohorts being in working age and therefore to a large number
- f contributors relative to the number of beneficiaries. It will require a lot of
effort and a mix of different strategies to bring the public transfer system in line with economic-demographic developments such as the retirement of low fertility cohorts and longevity. 6.1 Decomposing the HKIG Public benefits, public contributions and consequently the values of the HKIG depend on a wide variety of characteristics of the transfer systems. To identify the main determinants of the level of public benefits and contributions across countries we decompose both, contributions and benefits, into sub-indicators that describe important features of the public transfer systems. For each of the sub-indicators we calculate the coefficient of variation across countries. This shows us, which characteristics are the main determinants of the cross-country differences and thereby give us a hint what could be the most effective ways to adjust the transfer systems to ageing populations. The net benefits of the elderly are decomposed into the average level of benefits and the average number of years they are paid. The results are shown
SLIDE 21 Human Capital and the Sustainability of Public Transfers 21
in column (1) and (2) of Table 3. Across all countries (not weighted by pop- ulation size) the members of the 1950 cohort will be net receivers of public
- ld age benefits for 24 years, on average. The level of yearly transfer benefits
corresponds to about 31 percent of the production of a full-time worker. The level varies much more across countries than the number of years, indicat- ing a stronger influence on the cross-country differences. In Austria, Finland and Slovakia members of the 1950 cohort can expect public old age benefits amounting to around 10 YLFT or more. All of these countries are charac- terized by high levels of average benefits with a value of around 40 percent
- f YLFT. The corresponding level is only 21 percent in Bulgaria and 24 in
- Belgium. Note, that the YLFT captures the total cost of labour, including
employer-borne taxes and social contributions as well, hence the low old age benefits in relation to YLTF. The contributions of the child generation per member of the 1950 cohort consist of more components, as they also dependent on the size of the child generation and the the share of the public contributions that is transferred to the elderly. Total contributions over the working life can be calculated as the product of the average contribution in a year, the number of years with positive net contributions, the share of public contributions transferred to elderly and the number of children per member of the 1950 cohort. The values for each of these sub-indicators are shown in column (4)–(7) of Table
- 3. Again, it is the level of the average public contributions which explains
most of the variation across countries. The countries with the highest public contributions over working life, Austria, Italy and Sweden, are among those with the highest average levels of public contributions, amounting to more than 22 per cent of YLFT. Luxembourg is also characterized by high average levels
- f contributions, which is the result of a high share of workers paying labour
taxes in Luxembourg but living in other countries. There are rather little differences in the number of years of net contributions, which are projected to be 40, on average. The share of contributions paid to the elderly has been discussed already in Chapter 4. There are also considerable differences in the average number of children of a 1950 cohort member (Column 4), which have an effect on the total contributions of the child generation. The values range from 0.78 children per member of the 1950 cohort in Denmark, to 1.61 in Ireland.
SLIDE 22 22 Bernhard Hammer et al. Table 3 Decomposition of the HKIG
(1) (2) (3) (4) (5) (6) (7) (8) Avg. Share of
Total Avg. No. Total contri- No.
dren per contri- benefit years benefit bution years elderly member bution AT 0.40 25 10.0 0.24 41 68 0.96 6.4 BE 0.24 24 5.8 0.21 41 56 0.84 4.0 BG 0.21 22 4.7 0.13 43 69 1.10 4.1 CY 0.36 23 8.4 0.21 40 45 1.23 4.7 CZ 0.41 24 9.8 0.20 38 63 1.08 5.1 DE 0.29 23 6.7 0.19 42 68 0.87 4.8 DK 0.30 22 6.4 0.17 44 54 0.78 3.1 EE 0.31 23 7.2 0.17 42 62 1.11 5.0 EL 0.41 28 11.5 0.15 33 82 1.15 4.8 ES 0.27 26 7.0 0.11 41 62 1.11 3.0 FI 0.45 23 10.4 0.19 41 69 0.93 4.9 FR 0.31 26 8.3 0.19 41 62 1.09 5.2 HU 0.27 23 6.2 0.18 39 64 1.07 4.7 IE 0.27 24 6.5 0.07 40 48 1.61 2.3 IT 0.28 26 7.2 0.22 42 68 0.99 6.1 LT 0.25 23 5.9 0.10 38 57 1.15 2.6 LU 0.29 25 7.3 0.24 41 40 0.73 2.9 LV 0.25 23 5.8 0.11 38 59 1.17 2.9 PL 0.34 26 8.9 0.18 37 64 1.11 4.8 PT 0.28 27 7.6 0.12 38 63 1.09 3.1 RO 0.27 25 6.5 0.13 38 75 1.29 4.8 SE 0.37 21 7.8 0.23 42 59 1.01 5.7 SI 0.33 27 8.9 0.20 37 64 0.85 4.2 SK 0.38 25 9.5 0.11 36 65 1.23 3.2 Mean 0.31 24 7.68 0.17 40 62 1.06 4.3 Coeff var 0.19 0.08 0.22 0.27 0.06 0.14 0.17 0.26 Source: Authors’ own calculations.
7 Conclusion The economic exchange between children and the generation of their parents is at the very heart of societies and their most important institutions, including the family and the public welfare system. This mutual exchange between two generations can be described in terms of a generational contract: the parental generation provides resources for children until they are able to support them- selves and enter the labour force. The children in turn pay a share of their income for funding transfers to the elderly in form of pensions, health care and long-term care. The investment in children in the form of having children, nurturing and educating them are an essential element of the generational con- tract, which enables and justifies the transfer benefits received by the parental generation in retirement. According to this framework the crucial question regarding the sustainability of public transfers is, if these investments in chil- dren have been high enough to finance the expected old age transfers of the parental generation. Using age-specific data on public transfers, we compare the expected net public transfers received by a person born in 1950 and the expected amount
- f public transfers paid by the children. We find that in all of the analyzed
countries the projected old age benefits are considerably higher than the con- tribution of the children. The gap indicates insufficient investments in chil-
SLIDE 23 Human Capital and the Sustainability of Public Transfers 23
dren, which motivated the name human capital investment gap (HKIG) for
- ur indicator. The size of the gap is considerable: on average it would require
additional net public transfers corresponding to more than 3 times the yearly income of a full-time worker to finance old age benefits for the 1950 cohort at levels we observe in the 2010 cross-section data. For comparison, the total value of transfers to a 1950 cohort member that is expected to be paid by their children corresponds to slightly more than 4 times the yearly income of a full time worker. We find that even the increase of retirement age to age 70 would not be sufficient to balance benefits and contributions in most of the countries. A decomposition of the results shows, that the levels of benefits and contri- butions are the most important explanation of the cross-country differences. The number of years that an average member of the 1950 cohort is net receiver
- f benefits, as well as the number of years their children are contributors is
rather similar across countries. Our results indicate that an adjustment of retirement age is not sufficient to balance public contributions and benefits, adjustments in their level will be inevitable. A reform of public transfers towards a sustainable organization has to address the pivotal defect in the design of public transfers: transfers to the elderly depend on the level of investments in children, even if these investments are ignored in the calculation of the benefits. In a robust system, the rules determining public transfer benefits have to depend on the investments in the young generation, i.e. on the size of the younger generations and their ability to provide for the elderly. References Auerbach, A. J., Gokhale, J., and Kotlikoff, L. J. (1991). Generational Accounts–A Meaningful Alternative to Deficit Accounting. National Bu- reau of Economic Research; Working Paper No. 3589. Blanchard, O. J. (1990). Suggestions for a new set of fiscal indicators. OECD Economics Department Working Papers. Blanchard, O. J., Chouraqui, J.-C., Hagemann, R., and Sartor, N. (1990). The sustainability of fiscal policy: New answers to an old question. OECD Economic Studies No 15. Bonin, H. (2001). Generational accounting: Theory and Application. Springer Verlag. Bonin, H. and Raffelh¨ uschen, B. (1999). Public Finances in the European Union: Is Convergence Sustainable? Discussion Papers, Institut f¨ ur Fi- nanzwissenschaft, Unversit¨ at Freiburg. Bovenberg, A. L. (2008). Grey New World: Europe on the Road to Gerontoc- racy? CESifo Economic Studies, 54(1):55–72. Cardarelli, R., Sefton, J., and Kotlikoff, L. J. (2000). Generational Accounting in the UK. The Economic Journal, 110(467):547–574.
SLIDE 24 24 Bernhard Hammer et al.
Collins Dictionary of Law (2006). Contract. (n.d.). Retrieved July 28 2016 from http://legal-dictionary.thefreedictionary.com/contract. European Commission (2015). The 2015 Ageing Report: Economic and bud- getary projections for the 28 EU Member States (2013-2060). European Economy, (3). European Commission (2016). Fiscal Sustainability Report. Technical Report 018, European Commission. G´ al, R. I. and Monostori, J. (2016). Indicators of economic sustain- ability and intergenerational fairness. Public Deliverable 6.1; AGENTA Project. Download from: http://www.agenta-project.eu/Jacomo/ upload/publications/d-6.1-submitted.pdf. G´ al, R. I., Vanhuysse, P., and Vargha, L. (2017). Pro-elderly welfare states within pro-child societies. Journal of European Public Policy. Forthcoming. Working paper version download from: http://www.agenta-project.eu/ Jacomo/upload/publications/rg_wp-5-2016.pdf. Gallopin, G. C. (2005). Indicators and their use: Information for decision- making. In Redclift, M., editor, Sustainability: Critical Concepts in the Social Sciences, volume 3, pages 257–273. Routledge. Goldstein, J. R. and Kluge, F. (2016). Demographic pressures on european
- unity. Population and Development Review, 42(2):299–304.
Hammer, B., Loichinger, E., and Prskawetz, A. (2016). Projections of the Labour Force by Age, Gender and Highest Level of Educational Attain- ment until 2050. Public Deliverable of the AGENTA Project. Download from http://www.agenta-project.eu/Jacomo/upload/publications/0_ education_and_health_d7-1.pdf. Isteniˇ c, T., ˇ Seme, A., Hammer, B., Lotriˇ c Dolinar, A., and Sambt, J. (2016). The European NTA Manual. AGENTA Public Deliver-
- able. Download from: http://www.agenta-project.eu/Jacomo/upload/
publications/d-1.4-submitted.pdf (Accessed on 13 September 2016). Langenus, G. (2006). Fiscal Sustainability Indicators and Policy Design in the Face of Aging. National Bank of Belgium Working Paper No.102. Lee, R. and Mason, A., editors (2011). Population Aging and the Generational Economy: A Global Perspective. Edward Elgar Pub. Loichinger, E., Hammer, B., Prskawetz, A., Freiberger, M., and Sambt, J. (2017). Quantifying economic dependency. European Journal of Population, pages 1–30. Loichinger, E. and Prskawetz, A. (2017). Changes in economic activity: The role of age and education. Demographic Research, 36:1185–1208. Miller, T. (2011). The rise of the intergenerational state: aging and develop-
- ment. In Lee, R. and Mason, A., editors, Population Aging and the Gener-
ational Economy: A Global Perspective, pages 161–184. Edward Elgar Pub. Raffelh¨ uschen, B. (1999). Generational accounting in Europe. The American Economic Review, 89(2):167–170. Raffelh¨ uschen, B. and Gokhale, J. (2000). Population Aging and Fiscal Policy in Europe and the United States. CESifo Working Paper Series No. 237.
SLIDE 25
Human Capital and the Sustainability of Public Transfers 25
Seshamani, M. and Gray, A. (2004). Ageing and health-care expenditure: the red herring argument revisited. Health economics, 13(4):303–314. Sinn, H.-W. and Uebelmesser, S. (2003). Pensions and the path to gerontoc- racy in Germany. European Journal of Political Economy, 19(1):153–158. SNA (2009). System of National Accounts 2008. European Communities, International Monetary Fund, Organisation for Economic Co-operation and Development, United Nations and World Bank. Download from: http: //unstats.un.org/unsd/nationalaccount/docs/SNA2008.pdf (accessed 20 January 2014). UN (2013). National Transfer Accounts Manual: Measuring and Analysisng the Generational Economy. United Nations, Department of Economic and Social Affairs, Population Division. Whyte, S. R., Alber, E., and Van der Geest, S. (2008). Generational Con- nections and Conflicts in Africa: An Introduction. In Alber, E., Van der Geest, S., and Whyt, S. R., editors, Generations in Africa: Connections and Conflicts, pages 1–23. Lit Verlag Berlin, Germany. Wittgenstein Centre for Demography and Global Human Capital (2015). Wittgenstein Centre Data Explorer Version 1.2. Available at: www. wittgensteincentre.org/dataexplorer. Zweifel, P., Felder, S., and Werblow, A. (2004). Population ageing and health care expenditure: new evidence on the red herring. The Geneva Papers on Risk and Insurance Issues and Practice, 29(4):652–666.