
SLIDE 1
How to use Table and Data Graph Advanced Skill
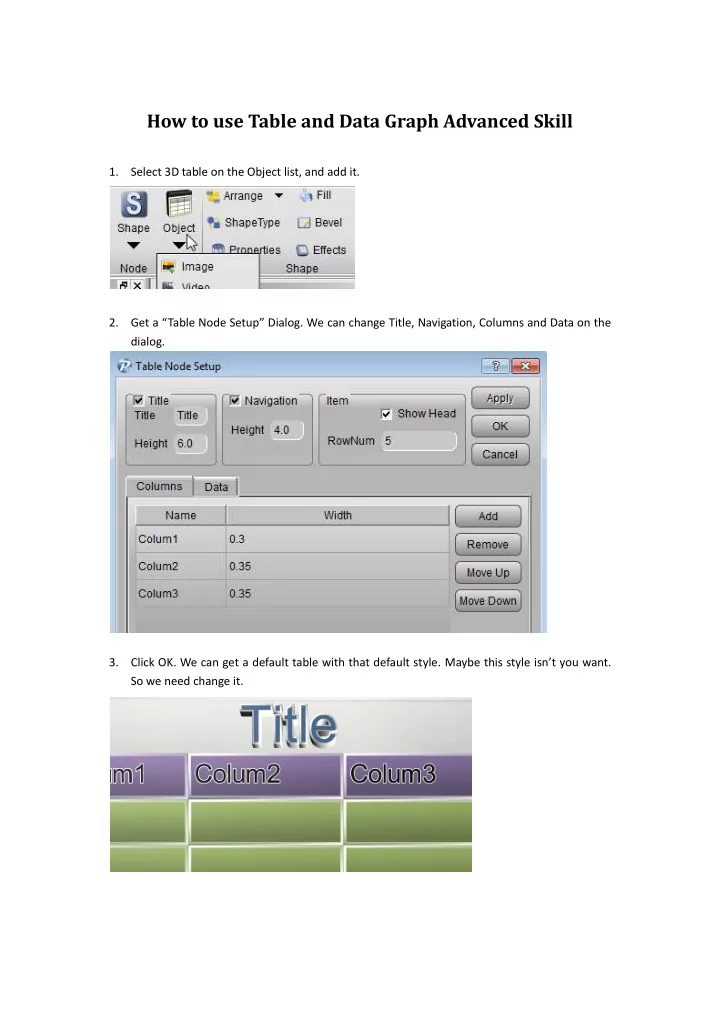
- 1. Select 3D table on the Object list, and add it.
- 2. Get a “Table Node Setup” Dialog. We can change Title, Navigation, Columns and Data on the
dialog.
- 3. Click OK. We can get a default table with that default style. Maybe this style isn’t you want.