
SLIDE 1
1
How is Light Made? How is Light Made?
Deducing Temperatures and Deducing Temperatures and Luminosities of Stars Luminosities of Stars (and other objects (and other objects… …) ) Review: Electromagnetic (EM) Radiation Review: Electromagnetic (EM) Radiation
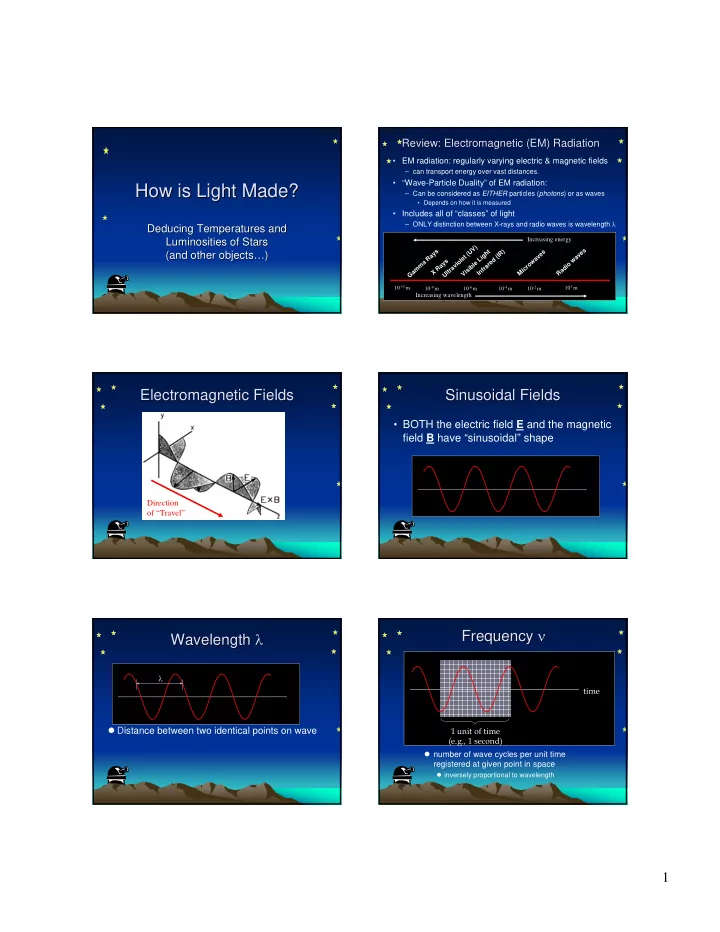
- EM radiation: regularly varying electric & magnetic fields
– can transport energy over vast distances.
- “Wave-Particle Duality” of EM radiation:
– Can be considered as EITHER particles (photons) or as waves
- Depends on how it is measured
- Includes all of “classes” of light
– ONLY distinction between X-rays and radio waves is wavelength λ
G a m m a R a y s U l t r a v i
- l
e t ( U V ) X R a y s V i s i b l e L i g h t I n f r a r e d ( I R ) M i c r
- w
a v e s R a d i
- w
a v e s
10-15 m 10-6 m 103 m 10-2 m 10-9 m 10-4 m
Increasing wavelength Increasing energy
Electromagnetic Fields Electromagnetic Fields
Direction
- f “Travel”
Sinusoidal Fields Sinusoidal Fields
- BOTH the electric field E and the magnetic
field B have “sinusoidal” shape
Wavelength Wavelength λ λ
Distance between two identical points on wave
λ
Frequency Frequency ν ν
number of wave cycles per unit time registered at given point in space
inversely proportional to wavelength
time 1 unit of time (e.g., 1 second)