
SLIDE 1
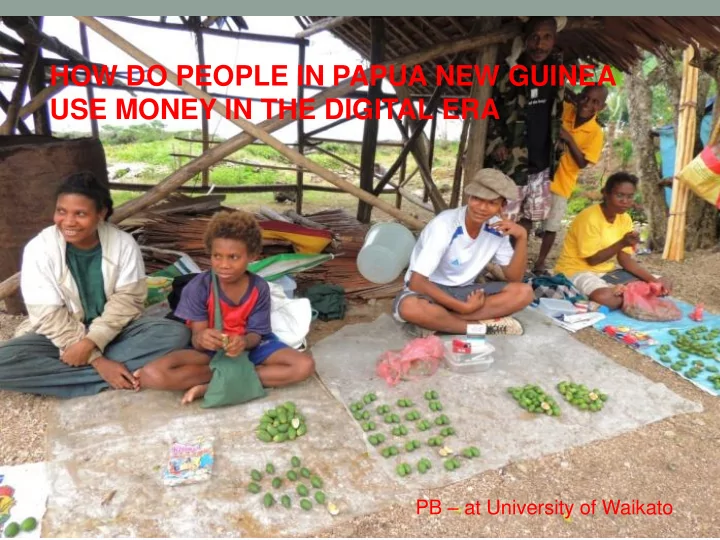
HOW DO PEOPLE IN PAPUA NEW GUINEA USE MONEY IN THE DIGITAL ERA
PB – at University of Waikato
HOW DO PEOPLE IN PAPUA NEW GUINEA USE MONEY IN THE DIGITAL ERA PB - - PowerPoint PPT Presentation
HOW DO PEOPLE IN PAPUA NEW GUINEA USE MONEY IN THE DIGITAL ERA PB at University of Waikato From the Papua New Guinea National Financial Capability Survey (and inputs from the Financial Diaries Study) September 2015 Conducted by Institute
PB – at University of Waikato
Conducted by Institute of National Affairs (INA), lead researcher Dr Jonathan Sibley Conducted for: Bank of Papua New Guinea, World Bank (Funding from Korea Trust Fund), Sampling Prof John Gibson, UOW, with NSO support, including Census data
the need to plan for retirement
NCD, Kimbe, and Goroka over 25 weeks capturing information from 240 respondents of which 50% women. Also quantitative transaction data, 45 in-depth qualitative interviews for better understand the rationale behind financial decisions.
centres for formal financial transactions and seldom use agents closer to place of stay.
factors (e.g. palm oil buyers and employers paid wages through direct bank deposits). These transactions on an average usually large, around PGK 400 and once in three weeks households face lump sum expenditure
networks to finance emergency expenditures like funerals which account to PGK 200 every four months.
and men who make financial decisions on behalf of their household
capability for PNG
excluded by the financial system, have effective access to the following financial services provided by formal institutions: credit, savings, payments, and insurance.” (GPFI & CGAP)
interest, given socio-economic environmental conditions.” (World Bank)
America, Africa, Middle East and East Asia and the Pacific
Target Actual Districts 8 8 Census Units 40 36 Households 400 359 Individual Surveys 800 688
Pacific Islands average 18.9 per 100,000 adults)
Tanzania 57 per 100,000 adults)
34 per 100,000 adult, Pacific Island CAGR 11.6%)
*BPNG and Global Findex
5.38m people
inclusion and financial literacy
Financial Inclusion (CEFI)
management of the Microfinance Expansion Project (MEP)
side data.
financial inclusion and financial literacy goals
inclusion and financial literacy policy and strategy
1.
To reach 1 million more unbanked low-income people in Papua New Guinea, 50% of whom will be women
2.
To lead efforts to create a financially competent generation of Papua New Guineans through financial education and financial literacy
3.
To actively support innovative use of technology for scaling-up access to financial services and financial literacy
4.
To strengthen consumer protection by issuing prudential guidelines and creating a platform for various national regulators and industry networks to monitor consumer protection
5.
To begin the process of integrating financial inclusion in local and national government, including getting the National Executive Council to endorse the National Financial Inclusion and Financial Literacy Strategy by quarter 4 of 2013
6.
To promote regular collection and use of financial access data to inform policy making and help identify key dimensions of financial inclusion in Papua New Guinea
7.
To optimize these results through knowledge sharing and effective coordination of stakeholders, including development partners, by the newly established Centre of Excellence for Financial Inclusion chaired by the Bank of Papua New Guinea.
10 20 30 40 50 60 70 under 15 15-64 64+
Age Profile - years of age (%)
Morobe Madang
5.4 5.9 5.5 7.4 5.3 Morobe Madang Nat Average Nat urban Nat rural
Average Household Size - 2011
200,000 300,000 400,000 500,000 600,000 700,000 800,000 Total citizens Male Female Total citizens under 18
Provincial Population (& Age and Gender breakdown- 2011)
Morobe Madang
0.0 10.0 20.0 30.0 40.0 50.0 60.0 70.0 80.0 % male % female % under 18 dependency ratio (<15 & >64: 15-64)
Population Profile %ages - Morobe and Madang Provs 2011
Morobe Madang
10 20 30 40 50 60 70 80 90 100 Morobe Madang National Ave Urban ave Rural ave
Literacy 2011 (%age of citizens)
all male female
10 20 30 40 50 60 70 80 90 Morobe Madang National Ave Urban ave Rural ave
Ever Been To School 2011 (% of Citizens)
all male female
10 20 30 40 50 60 70 Morobe Madang National Ave Urban ave Rural ave
%age in Wage Employment 2011
all male female
10 20 30 40 50 60 70 80 Morobe Madang National Ave Urban ave Rural ave
Subsistence Employment 2011 (% of employed population)
all male female
20 40 60 80 100 120 growing foodcrops growing betelnut selling food crops/cooked food selling betelnut mustard home ownership Trad dwellings
Household Profile - Livelihood and Home Ownership - % 2011
Morobe Madang Nat Average Nat urban Nat rural
5 10 15 20 25 30 35 40 45 Morobe Madang National Ave Urban ave Rural ave
Migrants 2011 (%age of Total Population)
all male female
least within a short walk from village)
* ‘Below the Glass Floor’, World Bank, 2013
appropriate product.
Banks S&Ls Micro- finance ANZ BSP WBC Total Branches Urban 3 4 2 9 2 2 Township 1 1 2 ATMs Urban 5 16 6 27 NA NA Township 1 1 NA NA Agents/ Instore Urban 11 4 ND NA NA Rural ND 23 ND NA NA * Data from organisation websites and BPNG
0% 10% 20% 30% 40% 50% 60% 70% 80% 90% 100% Male Female Male Female Male Female Urban Township Rural Cannot communicate in English Speak in English only Speak and read and/or write in English
Urban Township Rural Male Female Male Female Male Female Own/ access a Mobile Phone 94.40% 83.60% 96.60% 76.10% 48.40% 21.80% Make calls and texts 85.90% 87.90% 80.50% 36.10% 61.20% 44.90% Capacity for mobile phone banking 81.20% 73.50% 77.8% 27.5% 29.60% 9.80%
Urban Township Rural Male Female Male Female Male Female Formal Sector Informal Sector/ Self- employed Formal Sector Informal Sector/ Self- employed Formal Sector Informal Sector/ Self- employed Formal Sector Informal Sector/ Self- employed 7.30% 22.30% 36.20% 43.90% 10.30% 25.00% 29.70% 66.40% 60.20% 81.00% 1 14.00% 21.30% 23.00% 35.10% 9.70% 50.00% 27.70% 16.80% 18.80% 9.20% 2 7.30% 10.20% 8.20% 10.00% 14.80% 0.0.% 0.00% 16.80% 8.40% 5.10% 3> 71.40% 46.20% 32.70% 11.00% 65.20% 25.00% 42.60% 0.00% 12.60% 4.70%
Urban Township Rural Livelihood Male Female Male Female Male Female Formal Sector Informal Sector/ Self- employed Savings 68% 38% 83.60% 24.30% 21% 9% 62.30% 13.40% Long term savings 56% 28% 45.40% 17.10% 10% 5% 59.70% 3.50% Credit 50% 16% 13.00% 6.80% 6% 1% 25.50% 3.30% Protection 8% 8% 0% 0% 2% 0% 2.00% 1.50%
Has Account Does not have Account Urban Township Rural Urban Township Rural Day-day items such as food or transport Cash 79.2% 95.5% 88.0% 95.2% 97.2% 99.1% Electronic - Bank 20.8% 4.5% 12.0% 4.8% 2.8% 0.7% Bills Cash 61.3% 81.5% 93.0% 88.4% 90.3% 100.0% Electronic - Bank 27.7% 18.5% 0.0% 11.6% 9.7% 0.0% Mobile phone 11.1% 0.0% 7.0% 0.0% 0.0% 0.0% School or university fees Cash 31.4% 74.0% 88.6% 49.2% 72.7% 91.0% Electronic - Bank 68.6% 26.0% 11.4% 50.8% 27.3% 8.2% Loan repayments Cash 17.1% 17.8% 41.3% 31.7% 0.0% 47.5% Electronic - Bank 78.2% 82.2% 58.7% 68.3% 100.0% 52.5% Rent/ lease payments Cash 38.3% 39.5% 80.0% 84.2% 100.0% 92.5% Electronic - Bank 61.7% 60.5% 12.2% 15.8% 0.0% 7.5% Community/ religious donations Cash 100.0% 100.0% 86.2% 100.0% 100.0% 96.2% In-kind/ non-cash 0.0% 0.0% 13.8% 0.0% 0.0% 3.8%
0.0% 10.0% 20.0% 30.0% 40.0% 50.0% 60.0% 70.0% 80.0% Send Receive Send Receive Send Receive Urban Township Rural Mobile phone Post Office Bank Mail/ personal delivery
5 10 15 20 25 30 35 40 45 0.% 5.% 10.% 15.% 20.% 25.% 30.% 35.% 40.% 45.% Urban Township Rural Distance to Bank (KM) Has a Bank Account Has a Bank Account Distance to Bank
*location where an account can be opened
Urban Township Rural Male Female Male Female Male Female Savings/ Cheque (Debit Card) 55% 28% 52% 24% 10% 8% Savings (Passbook) 32% 13% 49% 4% 14% 1%
0.0% 10.0% 20.0% 30.0% 40.0% 50.0% 60.0% 70.0% 80.0% 90.0% Try to save money for the future Try to save money regularly Try to have some provision for emergencies/ unexpected expenses Does not have Savings Account Formal Sector Does not have Savings Account Informal Sector/ Self-employed Has Savings Account Formal Sector Has Savings Account Informal Sector/ Self-employed
Urban Township Rural Male Female Male Female Male Female Fixed Term Deposit 11% 0% 0% 0% 2% 1% Unit Trust/Shares 14% 6% 6% 0% 4% 1% Life Insurance 25% 8% 0% 0% 2% 1% Provident/ Superannuation 44% 25% 45% 17% 7% 4%
Urban Township Rural Male Female Male Female Male Female Commercial/ development loan 27% 7% 0% 7% 3% 1% Secured Personal/ House Loan 20% 6% 13% 0% 1% 1% Unsecured Personal/ House Loan 11% 3% 6% 0% 2% 0% Credit Card 8% 3% 0% 7% 4% 0%
institution (Global Findex)
principal barrier to financial inclusion
account (Global Findex)
women reported owning a savings account
significantly less likely to be financially included
Male Female Informal sector Formal sector Informal sector Formal sector Respondent only 30.7% 63.0% 5.6% 49.3% Respondent (solely or with someone else) 43.6% 87.5% 17.9% 58.1% Respondent’s partner (solely or with someone else) 2.0% 4.5% 29.8% 27.2% Nobody at all 46.8% 8.0% 45.9% 14.7%
0.0% 5.0% 10.0% 15.0% 20.0% 25.0% 30.0% Does not plan Days Weeks Months Six months or more Informal Sector/ Self-employed Formal Sector
friends
money.
Urban Township Rural Informal Sector/ Self- employed Formal Sector Informal Sector/ Self- employed Formal Sector Informal Sector/ Self- employed Formal Sector Insufficient/low income 33% 18% 31% 61% 42% 23% Fluctuating/unreliable income 6% 0% 27% 4% 35% 18% Unexpected expenses/events 38% 22% 23% 22% 11% 32% Increased cost of food and
20% 26% 19% 14% 18% 27% Need to provide financial help to others 24% 23% 15% 14% 6% 37% Overspending 31% 44% 27% 37% 16% 34% Failure to plan ahead/budget 31% 26% 31% 11% 34% 24%
0.1 0.2 0.3 0.4 0.5 0.6 0.7 0.8 Does not know much money spent personally in the last week? Does not know much money the household spent last week? Does not know much money you and your household have available for day-to-day spending Urban Township Rural
Cited Also Cited 1 2 3 4 5 6
education 44% 37% 15% 13% 9% 41%
20% 84% 26% 20% 15% 41%
children 8% 82% 62% 23% 29% 38%
9% 64% 42% 21% 25% 43%
children 6% 67% 49% 41% 39% 30%
33% 56% 24% 10% 12% 5%
*Households typically had been between 3-3.5 dependent children
Cited Also Cited 1 2 3 4 5 6 7 8 9
26% 12% 6% 2% 0% 10% 31% 36% 2%
assets 13% 25% 17% 3% 6% 12% 18% 48% 7%
7% 25% 33% 6% 6% 0% 17% 29% 10%
2% 33% 25% 25% 8% 0% 34% 27% 0%
1% 0% 100% 60% 20% 20% 0% 19% 20%
8% 34% 20% 0% 0% 2% 29% 58% 8%
13% 61% 17% 9% 4% 0% 17% 48% 5%
31% 31% 20% 6% 1% 0% 15% 21% 7%
3% 20% 35% 26% 0% 6% 24% 24% 79%
0% 10% 20% 30% 40% 50% 60% 70% 80% 90% 100% Male Female Male Female Formal Sector Informal Sector/ Self-employed Will provide enough money to cover expenses Will not provide enough money to cover expenses Has no strategies
0% 10% 20% 30% 40% 50% 60% 70% 80% 90% 100% Setting and managing the household budget Managing your household’s spending on essential items Managing regular household expenses Managing the household’s one-
Managing requests for financial assistance Managing the household’s financial documents Respondent Partner/ someone else No one
0.0% 10.0% 20.0% 30.0% 40.0% 50.0% 60.0% 70.0% 80.0% 90.0% 100.0% Setting and managing the household budget Managing your household’s spending on essential items Managing regular household expenses Managing the household’s one-
Managing requests for financial assistance Managing the household’s financial documents Male Female
0.0% 10.0% 20.0% 30.0% 40.0% 50.0% 60.0% 70.0% 80.0% Searched for information from a range of sources Considered alternatives Searched to find product best met needs Did not check product terms and conditions Urban Communicate in English Rural Communicate in English Urban Cannot Communicate in English Rural Cannot Communicate in English
Do not know how much interest has been have paid on loans over the past year 82% Do not know how much interest has been received on savings over the past year 86% Do not know the fees you have paid on financial products over the past year? 82%
products owned were principally savings products. There was very limited use of formal credit
products and services than urban households and exhibited lower levels of financial capability/ financial competence
likely to be involved in the management of household finances (other than the management of day-day expenditure) and were less likely to
were no longer working – other than relying on their children or family
very limited understanding of the cost of financial services
architecture
financial literacy programmes, in particular urban programmes in
consumer protection
people in Papua New Guinea, 50% of whom will be women
development of the rural financial services infrastructure, bringing large numbers of Papua New Guineans, who are currently financially excluded, into the formal financial system will not be possible
products/ services/programmes to bring women into the formal financial system, the goal of gender equity will probably not be achieved, rather the gender gap may be further exacerbated
scaling-up access to financial services and financial literacy
financial services delivery architecture for rural communities in PNG.
not economic
financial services architecture
in particular by women, suggests the expansion of mobile phone-based financial services (as opposed to the use of mobile telephony to deliver agent based financial services) in rural areas may require concurrent capacity building.