SLIDE 1
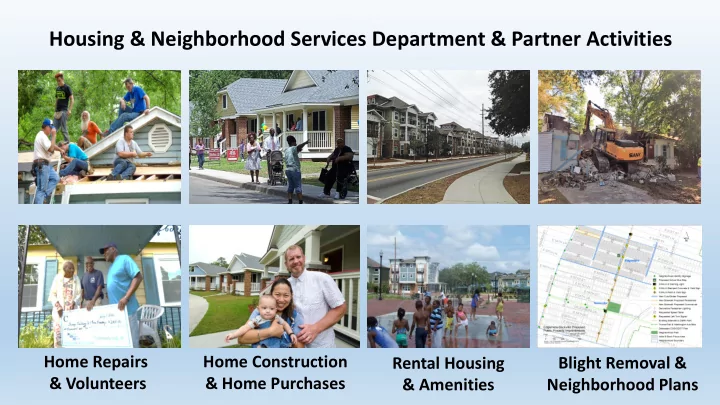
Home Repairs & Volunteers Home Construction & Home Purchases Rental Housing & Amenities
Housing & Neighborhood Services Department & Partner Activities
Blight Removal & Neighborhood Plans
SLIDE 2 Activity 2008 2009 2010 2011 2012 2013 2014 2015 2016 2017 Total % Home Repairs 239 191 213 121 162 154 166 144 171 155 1,716 37% Home Purchases 97 90 97 73 85 71 70 79 79 48 789 17% House Construction 46 49 32 39 38 28 21 21 11 18 303 7% Rental Ret/Rep/New 149 120 215 134 87 135 76 150 333 407 1,806 39% Total Dwellings 531 450 557 367 372 388 333 394 594 628 4,614 100% Investment/Millions 2008 2009 2010 2011 2012 2013 2014 2015 2016 2017 Total % Public $ 5.1 $ 4.2 $ 4.0 $ 6.0 $ 3.8 $ 3.0 $ 3.4 $ 3.2 $ 2.7 $ 2.6 $ 38.0 11% Private $29.9 $27.8 $38.1 $23.2 $10.6 $22.8 $17.7 $33.6 $40.0 $64.2 $307.9 89% Total Investment $35.0 $32.0 $42.1 $29.2 $14.4 $25.8 $21.1 $36.8 $42.7 $66.8 $345.9 100%
Source: Housing & Neighborhood Services Department, City of Savannah
Housing & Neighborhood Services Department & Partner Activities 10 Year Summary
SLIDE 3 705 Dwellings Impacted
- 92 Home Buyers
- 172 Home Repairs
- 19 Single Family Infill Housing
- 422 Multi Family Rental Housing
$74.73 Million Housing Investment
- .48M SAHSF
- 2.44M Pubic Funds (CDBG & HOME)
- 12.81M Private Investment Leveraged
- 59.00M Tax Credit & Bond Multifamily
$232,000 SAHSF Investments
- $150,000 City of Savannah
- $ 82,000 Bank, Hospital, Business and
Non-Profit Contributions
- Memorial Health joins SAHSF with $30K
2018 Summary Housing & Neighborhood Services Department & Partner Activities
SLIDE 4 Results (2012-2018) $13.9 million investments $1.4M deposits $2.6M loans and grants $9.9M leveraged investment SAHSF to Leveraged Ratio $1 to $8 256 Projects 160 houses repaired 36 houses built 60 houses purchased 196 Construction Contracts 161 (82%) minority contractors 15 ( 8%) non-minority contractors 20 (10%) non-profits Investors (Alphabetically) Ameris Bank BB&T Bank Bank of Ozark Bank South Community Housing Services Agency First Chatham Bank Group Cares Home Depot Foundation Memorial Health
- St. Joseph’s/Candler Health System
Savannah Woman’s Club Senior Citizens, Inc. South State Bank Synovus Bank United Community Bank United Way Wells Fargo
Savannah Affordable Housing Solutions Fund Historical Summary
SLIDE 5
2018 Summary City of Savannah & Housing Partners Strategic Plan – Goal 3.5 Access to Quality Housing
Type of Housing Units Initiated Goal Actual % of Goal Owner Occupied Home Repairs and/or Improvements 125 172 137% First Time Home Purchasers and/or New Home Construction 100 101 101% Rental Property Development and/or Improvements 125 432 345% Total 350 705 200% Savannah Affordable Housing Fund Investment Goal Actual % of Goal City of Savannah Investment $200,000 $150,000 75% Private Investment $100,000 $ 82,000 82% Total Investment $300,000 $232,000 66%
SLIDE 6 52,798 equals the total number of Savannah households 23,533 (45%) of Savannah households are cost burdened
- Being cost burdened is associated with households paying more than 30% of their
gross income toward rent or mortgage—something that is generally not affordable 21,522 (41%) of Savannah households making <$50,000 annually or <$24 hourly are cost burdened
- 15,631 renters
- 5,891 home owners
33,426 Savannah households earn <$50,000 annually or <$24 hourly
- Household income includes all adult persons earning income and sharing a
dwelling—related or unrelated
A Challenge to Consider: Cost of Quality Housing often Outpaces Incomes
SLIDE 7
Fair Market Rents & Required Incomes to Avoid Being Cost Burdened 1-Bedroom 2-Bedroom 3-Bedroom Fair Market Rents for Housing in Good Condition $ 926 $ 1,063 $ 1,453 Annual Household Income Required to Avoid Cost Burden $37,040 $42,520 $58,120 Hourly Household Income Required to Avoid Cost Burden $ 17.80 $ 20.44 $ 27.94 Fair Market Rents & Required Hours Per Week @ $7.25 Minimum Wage to Avoid Being Cost Burdened 1-Bedroom 98 Hours 2-Bedroom 113 Hours 3-Bedroom 154 Hours Worker Wages 40Hr/52Wk $10 Hourly $12 Hourly $14 Hourly $16 Hourly $18 Hourly $20 Hourly Annual Income $20,800 $24,960 $29,120 $33,280 $37,440 $41,600 Rent @ 30% of Income $520 $624 $728 $832 $936 $1,040 Rent Available for PI Bank Loan $244 $293 $342 $391 $440 $489 Development Cost 450 SF Eff Apt $72,000 $72,000 $72,000 $72,000 $72,000 $72,000 Bank Financing: 5% Int 20 Yr Am $36,972 $44,397 $51,822 $59,246 $66,671 $72,000 Gap Financing Required $35,028 $27,603 $20,178 $12,754 $ 5,329 $ 0
Impact on Low and Modest Wage Workforce Renters