SLIDE 27 27
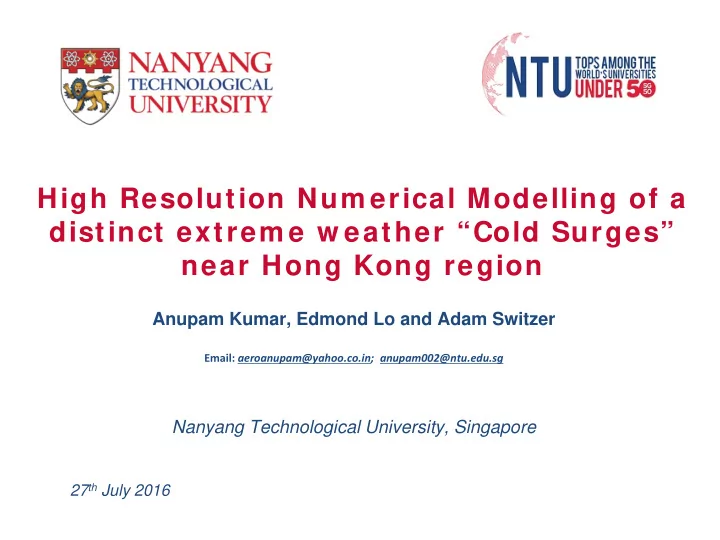
Pre redi dicted va d values a at HKO O (22 0
0 18
18‘ 07“ N, N, 114 114°10'27“ E) E) on
24th Ja Jan 201 2016
Time Series of MSLP
1031 1032 1033 1034 1035 1036 2 3 4 5 6 7 8 9 10 11 12 13 14
MSLP LP(hPa)
Num umber ber HK-Local cal UTC TC 2 2:00 AM 18 3 3:00 AM 19 4 4:00 AM 20 5 5:00 AM 21 6 6:00 AM 22 7 7:00 AM 23 8 8:00 AM 9 9:00 AM 1 10 10:00 AM 2 11 11:00 AM 3 12 12:00 PM 4 13 1:00 PM 5 14 2:00 PM 6
2 4 6 8 10 2 3 4 5 6 7 8 9 10 11 12 13 14
Temp ( p (de deg.
C)
10 20 30 40 50 2 3 4 5 6 7 8 9 10 11 12 13 14
Wind ( nd (km km/hr hr) Lowest temp
3.516
0C
predicted at 6 am
24th Jan. Max MSLP of 1034.86 hPa predicted at HKO at 9:am
Time Series of Temp Time Series of Wind