High Performance Computing, High Performance Computing, - - PDF document

high performance computing high performance computing
SMART_READER_LITE
LIVE PREVIEW

High Performance Computing, High Performance Computing, - - PDF document

T h e 1 4 t h S ym p os iu m on C om p u t e r A r c h it e c t u r e a n d H ig h P e r f or m a n c e C om p u t in g V it o r ia / E S - B r a z il - O c t ob e r 2 8 -3 0 , 2 0 0 2 High Performance Computing, High Performance


slide-1
SLIDE 1

1

1

High Performance Computing, High Performance Computing, Computational Grid, and Numerical Libraries Computational Grid, and Numerical Libraries

Jack Dongarra I nnovative Computing Lab University of Tennessee

ht t p:/ / ht t p:/ / www.cs.ut k.edu/ ~dongarra www.cs.ut k.edu/ ~dongarra/

T h e 1 4 t h S ym p os iu m on C om p u t e r A r c h it e c t u r e a n d H ig h P e r f or m a n c e C om p u t in g V it o r ia / E S - B r a z il - O c t ob e r 2 8 -3 0 , 2 0 0 2 2

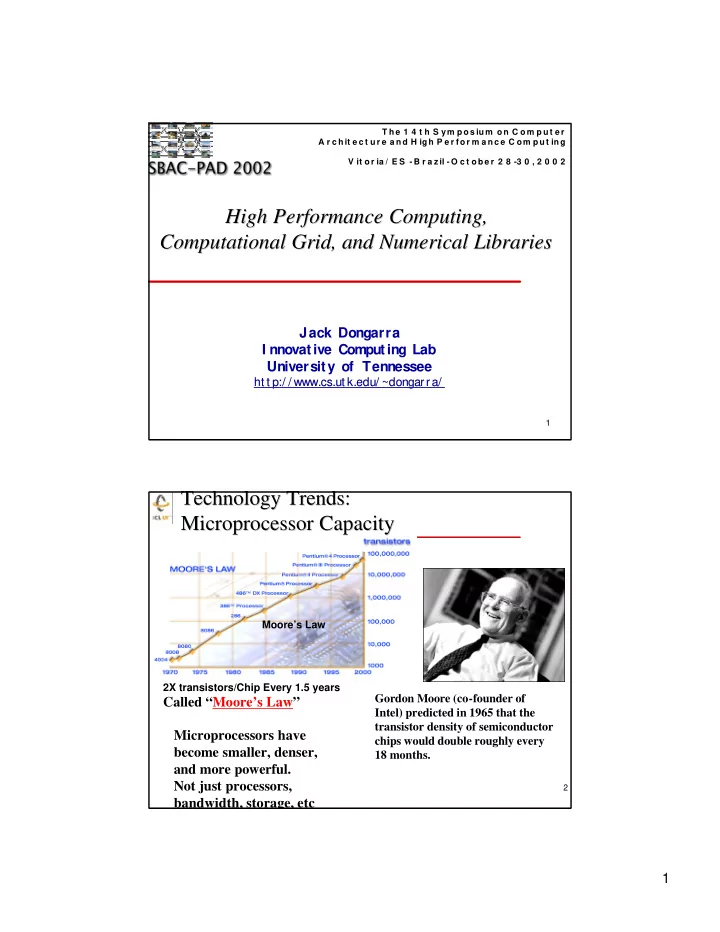
Technology Trends: Technology Trends: Microprocessor Capacity Microprocessor Capacity

2X transistors/Chip Every 1.5 years

Called “Moore’s Law”

Moore’s Law

Microprocessors have become smaller, denser, and more powerful. Not just processors, bandwidth, storage, etc

Gordon Moore (co-founder of Intel) predicted in 1965 that the transistor density of semiconductor chips would double roughly every 18 months.

slide-2
SLIDE 2

2

3

2005 2010 ASCI White Pacific EDSAC 1 UNIVAC 1 IBM 7090 CDC 6600 IBM 360/195 CDC 7600 Cray 1 Cray X-MP Cray 2 TMC CM-2 TMC CM-5 Cray T3D ASCI Red

1950 1960 1970 1980 1990 2000 2010 1 KFlop/s 1 MFlop/s 1 GFlop/s 1 TFlop/s 1 PFlop/s

Scalar Super Scalar Vector Parallel Super Scalar/Vector/Parallel

Moore’s Law Moore’s Law

4

  • H. Meuer, H. Simon, E. Strohmaier, & JD
  • H. Meuer, H. Simon, E. Strohmaier, & JD
  • Listing of the 500 most powerful

Computers in the World

  • Yardstick: Rmax from LINPACK MPP

Ax=b, dense problem

  • Updated twice a year

SC‘xy in the States in November Meeting in Mannheim, Germany in June

  • All data available from www.top500.org

Size Rate

TPP performance

slide-3
SLIDE 3

3

5

Fastest Computer Over Time

10 20 30 40 50 60 70

1990 1992 1994 1996 1998 2000

Year

GFlop/s

X Y ( S c a t t e r ) 1

Cray Y-MP (8) TMC CM-2 (2048) Fujitsu VP-2600

I n 1980 a computation that took 1 f ull year to complete can now be done in ~ 10 hours!

6

Fastest Computer Over Time

TMC CM-2 (2048) Fujitsu VP-2600 Cray Y-MP (8)

100 200 300 400 500 600 700

1990 1992 1994 1996 1998 2000

Year

GFlop/s

X Y ( S c a t t e r ) 1

Hitachi CP- PACS (2040) Intel Paragon (6788) Fujitsu VPP-500 (140) TMC CM-5 (1024) NEC SX-3 (4)

I n 1980 a computation that took 1 f ull year to complete can now be done in ~ 16 minutes!

slide-4
SLIDE 4

4

7

Fastest Computer Over Time

Hitachi CP-PACS (2040) Intel Paragon (6788) Fujitsu VPP-500 (140) TMC CM-5 (1024) NEC SX-3 (4) TMC CM-2 (2048) Fujitsu VP-2600 Cray Y-MP (8)

1000 2000 3000 4000 5000 6000 7000

1990 1992 1994 1996 1998 2000

Year

GFlop/s

X Y ( S c a t t e r ) 1

ASCI White Pacific (7424) Intel ASCI Red Xeon (9632) SGI ASCI Blue Mountain (5040) Intel ASCI Red (9152) ASCI Blue Pacific SST (5808)

I n 1980 a computation that took 1 f ull year to complete can today be done in ~ 27 seconds!

8

Fastest Computer Over Time

Hitachi CP-PACS (2040) Intel Paragon (6788) Fujitsu VPP-500 (140) TMC CM-5 (1024) NEC SX-3 (4) TMC CM-2 (2048) Fujitsu VP-2600 Cray Y-MP (8)

10 20 30 40 50 60 70 1990 1992 1994 1996 1998 2000

Year

TFlop/s

XY (Scatter) 1

2002

Intel ASCI Red (9152) ASCI White Pacific (7424) Intel ASCI Red Xeon (9632) ASCI Blue Mountain (5040)

Japanese Earth Simulator NEC 5104

I n 1980 a computation that took 1 f ull year to complete can today be done in ~ 5.4 seconds!

slide-5
SLIDE 5

5

9

Machines at the Top of the List Machines at the Top of the List

53% 140

236 124.5

Fujitsu NWT 1993 83% 6768

1.4 338 2.3 281.1

Intel Paragon XP/S MP 1994 83% 6768

1.0 338 1 281.1

Intel Paragon XP/S MP 1995 60% 2048

1.8 614 1.3 368.2

Hitachi CP-PACS 1996 73% 9152

3.0 1830 3.6 1338

Intel ASCI Option Red (200 MHz Pentium Pro) 1997 55% 5808

2.1 3868 1.6 2144

ASCI Blue-Pacific SST, IBM SP 604E 1998 74% 9632

0.8 3207 1.1 2379

ASCI Red Intel Pentium II Xeon core 1999 44% 7424

3.5 11136 2.1 4938

ASCI White-Pacific, IBM SP Power 3 2000 65% 7424

1.0 11136 1.5 7226

ASCI White-Pacific, IBM SP Power 3 2001 88% 5120

3.7 40960 5.0 35860

Earth Simulator Computer, NEC 2002 Efficiency Number of Processors

Factor ? from Pervious Year

Theoretica l Peak Gflop/s

Factor ? from Pervious Year

Measure d Gflop/s

Computer Year 10

A Tour A Tour d d’ ’Force Force in Engineering in Engineering

Homogeneous, Cent ralized, Proprietary, Expensive!

Target Application: CFD- Weat her, Climate, Earthquakes

640 NEC SX/ 6 Nodes (mod)

5120 CPUs which have vector ops ♦

40TeraFlops (peak)

$250- $ 500 million f or t hings in building

Footprint of 4 tennis courts

7 MWat t s

Say 10 cent/ K Whr - $16.8K/ day = $6M/ year! ♦

Expect to be on top of Top500 until 60- 100 TFlop ASCI machine arrives

For the Top500 (June 2002) Equivalent ~ 1/ 6 S Top 500 Perf ormance of ESC > S Next Top 12 Computers S of all the DOE computers = 27. 5 TFlop/ s Perf ormance of ESC > All the DOE + DOD machines (37. 2 TFlop/ s)

slide-6
SLIDE 6

6

11

Top10 of the Top500 Top10 of the Top500

Rank Manufacturer Computer Rmax [TF/s] Installation Site Country Year Area of Installation # Proc

1 NEC Earth-Simulator 35.86 Earth Simulator Center Japan 2002 Research 5120 2 IBM ASCI White SP Power3 7.23 Lawrence Livermore National Laboratory USA 2000 Research 8192 3 HP AlphaServer SC ES45 1 GHz 4.46 Pittsburgh Supercomputing Center USA 2001 Academic 3016 4 HP AlphaServer SC ES45 1 GHz 3.98 Commissariat a l’Energie Atomique (CEA) France 2001 Research 2560 5 IBM SP Power3 375 MHz 3.05 NERSC/LBNL USA 2001 Research 3328 6 HP AlphaServer SC ES45 1 GHz 2.92 Los Alamos National Laboratory USA 2002 Research 2048 7 Intel ASCI Red 2.38 Sandia National Laboratory USA 1999 Research 9632 8 IBM pSeries 690 1.3 GHz 2.31 Oak Ridge National Laboratory USA 2002 Research 864 9 IBM ASCI Blue Pacific SST, IBM SP 604e 2.14 Lawrence Livermore National Laboratory USA 1999 Research 5808 10 IBM pSeries 690 1.3 Ghz 2.00 IBM/US Army Reseach Lab (ARL) USA 2002 Vendor 768

12

TOP500 TOP500 -

  • Performance

Performance

1.17 TF/s 220 TF/s 35.8 TF/s 59.7 GF/s 134 GF/s 0.4 GF/s

J u n

  • 9

3 N

  • v
  • 9

3 J u n

  • 9

4 N

  • v
  • 9

4 J u n

  • 9

5 N

  • v
  • 9

5 J u n

  • 9

6 N

  • v
  • 9

6 J u n

  • 9

7 N

  • v
  • 9

7 J u n

  • 9

8 N

  • v
  • 9

8 J u n

  • 9

9 N

  • v
  • 9

9 J u n

  • N
  • v
  • J

u n

  • 1

N

  • v
  • 1

J u n

  • 2

Fujitsu 'NWT' NAL NEC Earth Simulator Intel ASCI Red Sandia IBM ASCI White LLNL

N=1 N=500 SUM

1 Gflop/s 1 Tflop/s 100 Mflop/s 100 Gflop/s 100 Tflop/s 10 Gflop/s 10 Tflop/s 1 Pflop/s

My Laptop

slide-7
SLIDE 7

7

13

Performance Extrapolation Performance Extrapolation

ASCI Purple

Earth Simulator Jun-93 Jun-94 Jun-95 Jun-96 Jun-97 Jun-98 Jun-99 Jun-00 Jun-01 Jun-02 Jun-03 Jun-04 Jun-05 Jun-06 Jun-07 Jun-08 Jun-09 Jun-10

N=1 N=500 Sum

1 GFlop/s 1 TFlop/s 1 PFlop/s 100 MFlop/s 100 GFlop/s 100 TFlop/s 10 GFlop/s 10 TFlop/s 10 PFlop/s

My Laptop 14

Manufacturers Manufacturers

HP 168 (12 < 100), IBM 164 (47 < 100)

Cray SGI IBM Sun HP TMC Intel Fujitsu NEC Hitachi

  • thers

100 200 300 400 500

Jun-93 Nov-93 Jun-94 Nov-94 Jun-95 Nov-95 Jun-96 Nov-96 Jun-97 Nov-97 Jun-98 Nov-98 Jun-99 Nov-99 Jun-00 Nov-00 Jun-01 Nov-01 Jun-02

slide-8
SLIDE 8

8

15

Architectures Architectures

Single Processor

SMP MPP SIMD

Constellation

Cluster - NOW

100 200 300 400 500 Jun-93 Nov-93 Jun-94 Nov-94 Jun-95 Nov-95 Jun-96 Nov-96 Jun-97 Nov-97 Jun-98 Nov-98 Jun-99 Nov-99 Jun-00 Nov-00 Jun-01 Nov-01 Jun-02

Y-MP C90 Sun HPC Paragon CM5 T3D T3E SP2 Cluster of Sun HPC ASCI Red CM2 VP500 SX3

Constellation: # of p/n n

16

Kflops Kflops per Inhabitant per Inhabitant

450 358 245 207 203 158 141 67 643

100 200 300 400 500 600 700

J a p a n U S A G e r m a n y S c a n d i n a v i a U K F r a n c e S w i t z e r l a n d I t a l y L u x e m b

  • u

r g

283 76

White is ES contribution and Blue is ASCI contribution

slide-9
SLIDE 9

9

17

80 Clusters on the Top500 80 Clusters on the Top500

♦ A total of 42 I ntel based and 8 AMD

based PC clusters are in the TOP500.

31 of these I ntel based cluster are I BM Netf inity systems delivered by I BM.

♦ A substantial part of these are installed

at industrial customers especially in the

  • il- industry.

I ncluding 5 Sun and 5 Alpha based clusters and 21 HP AlphaServer.

♦ 14 of these clusters are labeled as

' Self - Made' .

18

Cluster on the Top500 Cluster on the Top500

10 20 30 40 50 60 70 80 J u n

  • 9

7 N

  • v
  • 9

7 J u n

  • 9

8 N

  • v
  • 9

8 J u n

  • 9

9 N

  • v
  • 9

9 J u n

  • N
  • v
  • J

u n

  • 1

N

  • v
  • 1

J u n

  • 2

AMD Intel IBM Netfinity Alpha HP Alpha Server Sparc

Processor Breakdown

Pentium III, 37, 46% Itanium, 2, 3% Sparc, 5, 6% AMD, 8, 10% Alpha, 25, 31% Pentium 4, 3, 4%

slide-10
SLIDE 10

10

19

Distributed and Parallel Systems Distributed and Parallel Systems

Distributed systems hetero- geneous Massively parallel systems homo- geneous

G r i d b a s e d C

  • m

p u t i n g

G

  • g

l e N e t w

  • r

k

  • f

w s

C l u s t e r s w / s p e c i a l i n t e r c

  • n

n e c t

E n t r

  • p

i a / U D Earth Simulator

Gather (unused) resources

Steal cycles

System SW manages resources

System SW adds value

10% - 20% overhead is OK

Resources drive applications

Time to completion is not critical

Time- shared

SETI @home ~ 400,000 machines Averaging 40 Tf lop/ s

Bounded set of resources

Apps grow to consume all cycles

Application manages resources

System SW gets in the way

5% overhead is maximum

Apps drive purchase of equipment

Real- time constraints

Space- shared

Earth Simulator 5000 processors Averaging 35 Tf lop/ s

S E T I @ h

  • m

e P a r a l l e l D i s t m e m ASCI Tflop/s

20

SETI@home SETI@home: Global Distributed Computing : Global Distributed Computing

♦ Running on 500, 000 PCs, ~1000 CPU

Years per Day

485, 821 CPU Years so f ar

♦ Sophisticated Data & Signal

Processing Analysis

♦ Distributes Datasets f rom Arecibo

Radio Telescope

slide-11
SLIDE 11

11

21

SETI@home SETI@home

♦ Use thousands of I nternet-

connected PCs to help in the search f or extraterrestrial intelligence.

♦ When their computer is idle

  • r being wasted this

sof tware will download a 300 kilobyte chunk of data f or analysis. Perf orms about 3 Tf lops f or each client in 15 hours.

♦ The results of this analysis

are sent back to the SETI team, combined with thousands of other participants.

♦ Largest distributed

computation project in existence

2500 machines today Averaging 40 Tf lop/ s

♦ Today a number of

companies trying this f or prof it.

22

Grid Computing Grid Computing -

  • from ET

from ET toAnthrax toAnthrax

slide-12
SLIDE 12

12

23

♦ Google query attributes

150M queries/ day (2000/ second) 3B documents in the index

♦ Data centers

15, 000 Linux systems in 6 data centers

15 TFlop/ s and 1000 TB total capability 40- 80 1U/ 2U servers/ cabinet 100 MB Ethernet switches/ cabinet with gigabit Ethernet uplink

growth f rom 4, 000 systems (June 2000)

18M queries then

♦ Perf ormance and operation

simple reissue of f ailed commands to new servers no perf ormance debugging

problems are not reproducible

Source: Monika Henzinger, Google

24

♦ Today there is a complex interplay and

increasing interdependence among the sciences.

♦ Many science and engineering problems require

widely dispersed resources be operated as systems.

♦ What we do as collaborative inf rastructure

developers will have prof ound inf luence on the f uture of science.

♦ Networking, distributed computing, and parallel

computation research have matured to make it possible f or distributed systems to support high- perf ormance applications, but. . .

Resources are dispersed Connectivity is variable Dedicated access may not be possible

In the past: Isolation Motivation for Grid Computing Motivation for Grid Computing

Today: Collaboration

slide-13
SLIDE 13

13

25

The Grid

26

I PG NASA http:/ / nas.nasa.gov/ ~wej/ home/ I PG Globus http:/ / www. globus. org/ Legion http:/ / www.cs.virgina.edu/ ~grimshaw/ AppLeS http:/ / www- cse.ucsd.edu/ groups/ hpcl/ NetSolve http:/ / www.cs.utk.edu/ netsolve/ NI NF http:/ / phase.etl.go.jp/ ninf/ Condor http:/ / www.cs.wisc.edu/ condor/ CUMULVS http:/ / www.epm.ornl.gov/ cs/ WebFlow http:/ / www.npac.syr.edu/ users/ gcf / NGC http:/ / www. nordicgrid. net

Grids are Hot Grids are Hot

slide-14
SLIDE 14

14

27

University of Tennessee Deployment: University of Tennessee Deployment: Scalable calable In Intracampus tracampus Research esearch Grid: rid: SInRG SInRG

Federated Ownership: CS, Chem

  • Eng. , Medical School,

Comput at ional Ecology, El. Eng.

Real applicat ions, middleware development, logistical net working

The Knoxville Campus has two DS-3 commodity Internet connections and one DS-3 Internet2/Abilene connection. An OC-3 ATM link routes IP traffic between the Knoxville campus, National Transportation Research Center, and Oak Ridge National Laboratory. UT participates in several national networking initiatives including Internet2 (I2), Abilene, the federal Next Generation Internet (NGI) initiative, Southern Universities Research Association (SURA) Regional Information Infrastructure (RII), and Southern Crossroads (SoX). The UT campus consists of a meshed ATM OC-12 being migrated over to switched Gigabit by early 2002.

28

Grids vs. Capability Computing Grids vs. Capability Computing

♦ Not an “either/ or” question

each addresses dif f erent needs both are part of an integrated solution

♦ Grid strengths

coupling necessarily distributed resources

instruments, archives, and people

eliminating time and space barriers

remote resource access and capacity computing

Grids are not a cheap substitute f or capability HPC

♦ Capability computing strengths

supporting f oundational computations

terascale and petascale “nation scale” problems

engaging tightly coupled teams and computations

slide-15
SLIDE 15

15

29

Software Technology & Performance Software Technology & Performance

♦ Tendency to f ocus on hardware ♦ Sof tware required to bridge an ever widening gap ♦ Gaps between usable and deliverable perf ormance

is very steep

Perf ormance only if the data and controls are setup just right

Otherwise, dramatic perf ormance degradations, very unstable situation Will become more unstable

♦ Challenge of Libraries, PSEs and Tools is

f ormidable with Tf lop/ s level, even greater with Pf lops, some might say insurmountable.

30

Where Does the Performance Go? or Where Does the Performance Go? or Why Should I Care About the Memory Hierarchy? Why Should I Care About the Memory Hierarchy?

µProc 60%/yr. (2X/1.5yr) DRAM 9%/yr. (2X/10 yrs)

1 10 100 1000

1980 1981 1983 1984 1985 1986 1987 1988 1989 1990 1991 1992 1993 1994 1995 1996 1997 1998 1999 2000

DRAM CPU

1982

Performance

Time

“Moore’s Law” Processor-DRAM Memory Gap (latency) Processor-Memory Performance Gap: (grows 50% / year)

slide-16
SLIDE 16

16

31

Optimizing Computation and Optimizing Computation and Memory Use Memory Use

♦ Computational optimizations

Theoretical peak:(# f pus)*(f lops/ cycle) * Mhz

Pentium 4: (1 f pu)*(2 f lops/ cycle)*(2. 53 Ghz) = 5060 MFLOP/ s

♦ Operations like:

α = xTy : 2 operands (16 Bytes) needed f or 2 f lops; at 5060 Mf lop/ s will requires 5060 MW/ s bandwidth

y = α x + y : 3 operands (24 Bytes) needed f or 2 f lops;

at 5060 Mf lop/ s will requires 7590 MW/ s bandwidth

♦ Memory optimization

Theoretical peak: (bus width) * (bus speed)

Pentium 4: (32 bits)*(533 Mhz) = 2132 MB/ s = 266 MW/ s

32

Memory Hierarchy Memory Hierarchy

♦ By taking advantage of the principle of locality:

Present the user with as much memory as is available in the cheapest technology. Provide access at the speed of f ered by the f astest technology.

Control Datapath Secondary Storage (Disk) Processor Registers Main Memory (DRAM) Level 2 and 3 Cache (SRAM) On-Chip Cache 1s 10,000,000s (10s ms) 100,000 s (.1s ms) Speed (ns): 10s 100s 100s Gs Size (bytes): Ks Ms Tertiary Storage (Disk/Tape) 10,000,000,000s (10s sec) 10,000,000 s (10s ms) Ts Distributed Memory Remote Cluster Memory

slide-17
SLIDE 17

17

33

Self Adapting Software Self Adapting Software

♦ Sof tware system that …

Obtains inf ormation on the underlying system where they will run. Adapts application to the presented data and the available resources perhaps provide automatic algorithm selection During execution perf orm optimization and perhaps reconf igure based on newly available resources. Allow the user to provide f or f aults and recover without additional users involvement

♦ The moral of the story

We know the concepts of how to improve things. Capture insights/ experience – do what humans do well Automate the dull stuf f

34

Software Generation Software Generation Strategy Strategy -

  • ATLAS BLAS

ATLAS BLAS

♦ Takes ~ 20 minutes to run,

generates Level 1,2, & 3 BLAS

♦ “New” model of high

perf ormance programming where critical code is machine generated using parameter

  • ptimization.

♦ Designed f or modern

architectures

Need reasonable C compiler ♦ Today ATLAS in used within

various ASCI and SciDAC activities and by Matlab, Mathematica, Octave, Maple, Debian, Scyld Beowulf , SuSE,…

♦ Parameter study of the hw ♦ Generate multiple versions

  • f code, w/ dif f erence

values of key perf ormance parameters

♦ Run and measure the

perf ormance f or various versions

♦ Pick best and generate

library

♦ Level 1 cache multiply

  • ptimizes f or:

TLB access L1 cache reuse FP unit usage Memory f etch Register reuse Loop overhead minimization

slide-18
SLIDE 18

18

35

ATLAS ATLAS (DGEMM n = 500)

(DGEMM n = 500)

ATLAS is f aster than all other portable BLAS implementations and it is comparable with machine- specif ic libraries provided by the vendor.

Looking at sparse operations

0.0 500.0 1000.0 1500.0 2000.0 2500.0 3000.0 3500.0

A M D A t h l

  • n
  • 6

D E C e v 5 6

  • 5

3 3 D E C e v 6

  • 5

H P 9 / 7 3 5 / 1 3 5 I B M P P C 6 4

  • 1

1 2 I B M P

  • w

e r 2

  • 1

6 I B M P

  • w

e r 3

  • 2

I n t e l P

  • I

I I 9 3 3 M H z I n t e l P

  • 4

2 . 5 3 G H z w / S S E 2 S G I R 1 i p 2 8

  • 2

S G I R 1 2 i p 3

  • 2

7 S u n U l t r a S p a r c 2

  • 2

Architectures MFLOP/S

Vendor BLAS ATLAS BLAS F77 BLAS 36

GrADS GrADS -

  • Grid Application Development

Grid Application Development System System

♦ Problem: Grid has distributed, heterogeneous,

dynamic resources; how do we use them?

♦ Goal: reliable perf ormance on dynamically

changing resources

♦ Minimize work of preparing an application f or

Grid execution

Provide generic versions of key components (currently built in to applications or manually done)

  • E. g. , scheduling, application launch, perf ormance

monitoring

♦ Provide high- level programming tools to help

automate application preparation

Perf ormance modeler, mapper, binder

slide-19
SLIDE 19

19

37

NSF/NGS NSF/NGS GrADS GrADS -

  • GrADSoft

GrADSoft Architecture Architecture

♦ Goal: reliable perf ormance on

dynamically changing resources

Whole- Program Compiler Libraries Binder Real-time Performance Monitor Performance Problem Resource Negotiator Scheduler Grid Runtime System Source Appli- cation Config- urable Object Program Software Components Performance Feedback Negotiation

PIs: Ken Kennedy, Fran Berman, Andrew Chein, Keith Cooper, JD, Ian Foster, Lennart Johnsson, Dan Reed, Carl Kesselman, John Mellor-Crummey, Linda Torczon & Rich Wolski 38

NSF/NGS NSF/NGS GrADS GrADS -

  • GrADSoft

GrADSoft Architecture Architecture

♦ Goal: reliable perf ormance on

dynamically changing resources

Whole- Program Compiler Libraries Binder Real-time Performance Monitor Performance Problem Resource Negotiator Scheduler Grid Runtime System Source Appli- cation Config- urable Object Program Software Components Performance Feedback Negotiation

PIs: Ken Kennedy, Fran Berman, Andrew Chein, Keith Cooper, JD, Ian Foster, Lennart Johnsson, Dan Reed, Carl Kesselman, John Mellor-Crummey, Linda Torczon & Rich Wolski

slide-20
SLIDE 20

20

39

Intelligent Component Intelligent Component

♦ System to mediate between

user application and multiple possible libraries

♦ Self - Adaptivity and Learning

Behavior

Heuristics are tuned based on data

System gradually gets smarter (database)

The system can educate the user ♦ User I nteraction User can guide the system by providing f urther inf ormation System teaches user about properties of the data

40

Research Areas Research Areas

♦ Automatically generating perf ormance models

(e. g. f or ScaLAPACK) on Grid resources

♦ Evaluating Perf ormance “Contracts” ♦ Near Optimal Scheduling (execution) on the

Grid

♦ Rescheduling f or changing resources ♦ Checkpointing and f ault tolerance ♦ High- latency tolerant algorithms (SANS ideas) ♦ Porting applications/ libraries to GrADS

f ramework

♦ Developing generic GrADSof t interf aces (API ’s)

slide-21
SLIDE 21

21

41

LAPACK For Clusters LAPACK For Clusters

♦ Developing middleware which couples cluster system

inf ormation with the specif ics of a user problem to launch cluster based applications on the “best” set of resource available.

♦ Using ScaLAPACK as the prototype sof tware, but

developing a f ramework

~ Mbit Switch, (fully connected) ~ Gbit Switch, (fully connected)

Remote memory server, e.g. IBP (TCP/IP)

Local network file server, SUN’s NFS (UDP/IP) e.g. 100 Mbit Users, etc.

42 GrADS ScaLAPACK versus Non-GrADS ScaLAPACK

500 1000 1500 2000 2500

N=20000 - GrADS (14 proc) N=20000 - Non GrADS (17 proc) N=15000 - GrADS (15 proc) N=15000 - Non GrADS (17 proc) N=10000 - GrADS (10 proc) N=1000 - Non GrADS (17 proc) N=5000 - Grads (6 proc) N=5000 - NonGrADS (17 proc)

Time Taken (seconds) Grid consists of 17 machines from two heterogeneous, shared (possibly loaded) clusters. GrADS schedules execution on appropriate machines. Non-GraDS uses the ALL the machines.

ScaLAPACK Application Grid Overhead / Spawn GrADS Overhead

slide-22
SLIDE 22

22

43

Research Directions Research Directions

♦ Parameterizable libraries ♦ Fault tolerant algorithms ♦ Annotated libraries ♦ Hierarchical algorithm libraries ♦ “Grid” (network) enabled strategies

A new division of labor between compiler writers, library writers, and algorithm developers and application developers will emerge.

44

Futures for Numerical Algorithms and Software Futures for Numerical Algorithms and Software

♦ Numerical sof tware will be adaptive,

exploratory, and intelligent

♦ Determinism in numerical computing will

be gone.

Af ter all, its not reasonable to ask f or exactness in numerical computations.

Auditability of the computation, reproducibility at a cost

♦ I mportance of f loating point arithmetic

will be undiminished.

16, 32, 64, 128 bits and beyond.

♦ Reproducibility, f ault tolerance, and

auditability

♦ Adaptivity is a key so applications can

ef f ectively use the resources.

slide-23
SLIDE 23

23

45

Collaborators / Support Collaborators / Support

♦ TOP500

  • H. Mauer, Mannheim U
  • H. Mauer, Mannheim U
  • H. Simon, NERSC
  • H. Simon, NERSC
  • E. Strohmaier, NERSC
  • E. Strohmaier, NERSC

♦ GrADS

Sathish Vadhiyar, UTK Asim YarKhan, UTK

Ken Kennedy, Fran Berman, Andrew Chein, Keit h Cooper, I an Fost er, Carl Kesselman, Lennart J ohnsson, Dan Reed, Linda Torczon, & Rich Wolski

Thanks

NSF Next Generation Softw are (NGS) Scientific Discovery through Advanced Computing (SciDAC)