High Performance Computing, High Performance Computing, - - PDF document

high performance computing high performance computing
SMART_READER_LITE
LIVE PREVIEW

High Performance Computing, High Performance Computing, - - PDF document

th High 17 th 17 High- -Performance Computing Symposium Performance Computing Symposium st OSCAR Symposium 1 st 1 OSCAR Symposium May 11- -14, 2003 14, 2003 May 11 Sherbrooke Delta Hotel Sherbrooke Delta Hotel Qubec, CANADA Qubec,


slide-1
SLIDE 1

1

1

High Performance Computing, High Performance Computing, Computational Grid, and Numerical Libraries Computational Grid, and Numerical Libraries

Jack Dongarra Innovative Computing Lab University of Tennessee and Computer Science and Math Div Oak Ridge National Lab

http:// http://www.cs.utk.edu/~dongarra www.cs.utk.edu/~dongarra/ /

17 17th

th High

High-

  • Performance Computing Symposium

Performance Computing Symposium 1 1st

st OSCAR Symposium

OSCAR Symposium May 11 May 11-

  • 14, 2003

14, 2003 Sherbrooke Sherbrooke Delta Hotel Delta Hotel Québec, CANADA Québec, CANADA

2

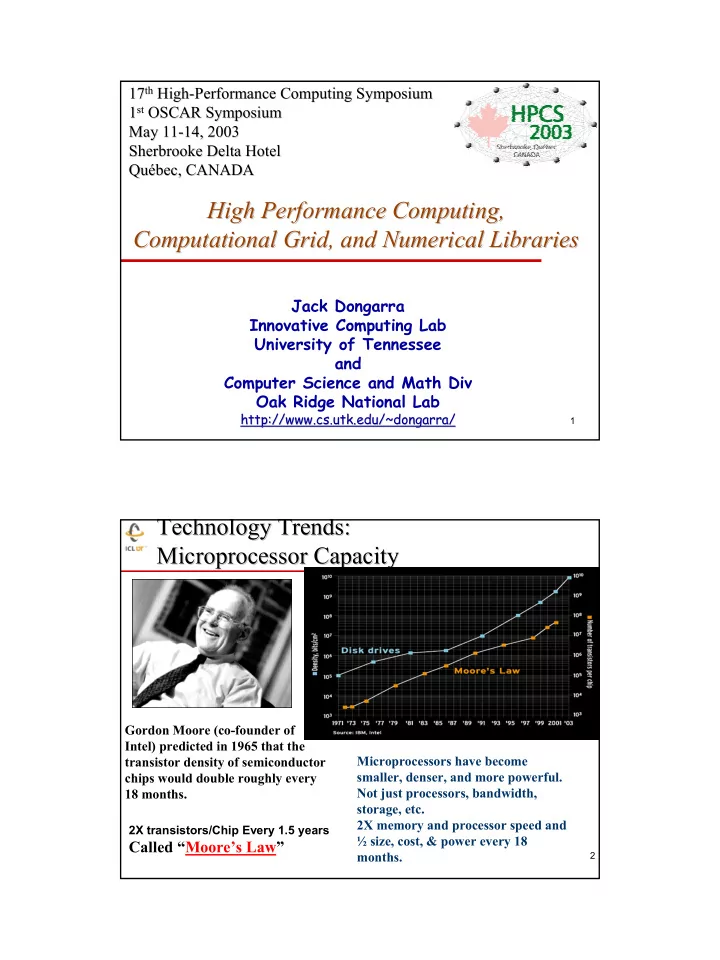
Technology Trends: Technology Trends: Microprocessor Capacity Microprocessor Capacity

2X transistors/Chip Every 1.5 years

Called “Moore’s Law”

Microprocessors have become smaller, denser, and more powerful. Not just processors, bandwidth, storage, etc. 2X memory and processor speed and ½ size, cost, & power every 18 months. Gordon Moore (co-founder of Intel) predicted in 1965 that the transistor density of semiconductor chips would double roughly every 18 months.

slide-2
SLIDE 2

2

3 Earth Simulator ASCI White Pacific EDSAC 1 UNIVAC 1 IBM 7090 CDC 6600 IBM 360/195 CDC 7600 Cray 1 Cray X-MP Cray 2 TMC CM-2 TMC CM-5 Cray T3D ASCI Red

1950 1960 1970 1980 1990 2000 2010 1 KFlop/s 1 MFlop/s 1 GFlop/s 1 TFlop/s 1 PFlop/s

Scalar Super Scalar Vector Parallel Super Scalar/Vector/Parallel

Moore’s Law Moore’s Law

4

  • H. Meuer, H. Simon, E. Strohmaier, & JD
  • H. Meuer, H. Simon, E. Strohmaier, & JD
  • Listing of the 500 most powerful

Computers in the World

  • Yardstick: Rmax from LINPACK MPP

Ax=b, dense problem

  • Updated twice a year

SC‘xy in the States in November Meeting in Mannheim, Germany in June

  • All data available from www.top500.org

Size Rate

TPP performance

slide-3
SLIDE 3

3

5

Fastest Computer Over Time

10 20 30 40 50 60 70

1990 1992 1994 1996 1998 2000

Year

GFlop/s

X Y (S c a tte r) 1

Cray Y-MP (8) TMC CM-2 (2048) Fujitsu VP-2600

In 1980 a computation that took 1 full year to complete can now be done in ~ 10 hours!

6

Fastest Computer Over Time

TMC CM-2 (2048) Fujitsu VP-2600 Cray Y-MP (8)

100 200 300 400 500 600 700

1990 1992 1994 1996 1998 2000

Year

GFlop/s

X Y (S c a tte r) 1

Hitachi CP- PACS (2040) Intel Paragon (6788) Fujitsu VPP-500 (140) TMC CM-5 (1024) NEC SX-3 (4)

In 1980 a computation that took 1 full year to complete can now be done in ~ 16 minutes!

slide-4
SLIDE 4

4

7

Fastest Computer Over Time

Hitachi CP-PACS (2040) Intel Paragon (6788) Fujitsu VPP-500 (140) TMC CM-5 (1024) NEC SX-3 (4) TMC CM-2 (2048) Fujitsu VP-2600 Cray Y-MP (8)

1000 2000 3000 4000 5000 6000 7000

1990 1992 1994 1996 1998 2000

Year

GFlop/s

X Y (S c a tte r) 1

ASCI White Pacific (7424) Intel ASCI Red Xeon (9632) SGI ASCI Blue Mountain (5040) Intel ASCI Red (9152) ASCI Blue Pacific SST (5808)

In 1980 a computation that took 1 full year to complete can today be done in ~ 27 seconds!

8

Fastest Computer Over Time

Hitachi CP-PACS (2040) Intel Paragon (6788) Fujitsu VPP-500 (140) TMC CM-5 (1024) NEC SX-3 (4) TMC CM-2 (2048) Fujitsu VP-2600 Cray Y-MP (8)

10 20 30 40 50 60 70 1990 1992 1994 1996 1998 2000

Year

TFlop/s

XY (Scatter) 1

2002

Intel ASCI Red (9152) ASCI White Pacific (7424) Intel ASCI Red Xeon (9632) ASCI Blue Mountain (5040)

Japanese Earth Simulator NEC 5120

In 1980 a computation that took 1 full year to complete can today be done in ~ 5.4 seconds!

slide-5
SLIDE 5

5

9

Machines at the Top of the List Machines at the Top of the List

53% 140

236 124.5

Fujitsu NWT 1993 83% 6768

1.4 338 2.3 281.1

Intel Paragon XP/S MP 1994 83% 6768

1.0 338 1 281.1

Intel Paragon XP/S MP 1995 60% 2048

1.8 614 1.3 368.2

Hitachi CP-PACS 1996 73% 9152

3.0 1830 3.6 1338

Intel ASCI Option Red (200 MHz Pentium Pro) 1997 55% 5808

2.1 3868 1.6 2144

ASCI Blue-Pacific SST, IBM SP 604E 1998 74% 9632

0.8 3207 1.1 2379

ASCI Red Intel Pentium II Xeon core 1999 44% 7424

3.5 11136 2.1 4938

ASCI White-Pacific, IBM SP Power 3 2000 65% 7424

1.0 11136 1.5 7226

ASCI White-Pacific, IBM SP Power 3 2001 88% 5120

3.7 40960 5.0 35860

Earth Simulator Computer, NEC 2002 Efficiency Number of Processors

Factor Δ from Pervious Year Theoretical Peak Gflop/s Factor Δ from Pervious Year Measured Gflop/s

Computer Year 10

A Tour de Force in Engineering A Tour de Force in Engineering

Homogeneous, Centralized, Proprietary, Expensive!

Target Application: CFD- Weather, Climate, Earthquakes

640 NEC SX/6 Nodes (mod)

5120 CPUs which have vector ops Each CPU 8 Gflop/s Peak ♦

40 TFlop/s (peak)

$250-$500 million for things in building

Footprint of 4 tennis courts

7 MWatts

Say 10 cent/KWhr - $16.8K/day = $6M/year! ♦

Expect to be on top of Top500 until 60-100 TFlop ASCI machine arrives

For the Top500 (November 2002) Performance of ESC ≈ Σ Next Top 7 Computers Σ of DOE computers (DP&OS) = 49 TFlop/s

slide-6
SLIDE 6

6

11

20th List: The TOP10 20th List: The TOP10

Rank Manufacturer Computer Rmax [TF/s] Installation Site Country Year Area of Installation # Proc 1 NEC Earth-Simulator 35.86 Earth Simulator Center Japan 2002 Research 5120 2 HP ASCI Q, AlphaServer SC 7.73 Los Alamos National Laboratory USA 2002 Research 4096 2 HP ASCI Q, AlphaServer SC 7.73 Los Alamos National Laboratory USA 2002 Research 4096 4 IBM ASCI White SP Power3 7.23 Lawrence Livermore National Laboratory USA 2000 Research 8192 5 Linux NetworX MCR Cluster 5.69 Lawrence Livermore National Laboratory USA 2002 Research 8192 6 HP AlphaServer SC ES45 1 GHz 4.46 Pittsburgh Supercomputing Center USA 2001 Academic 3016 7 HP AlphaServer SC ES45 1 GHz 3.98 Commissariat a l’Energie Atomique (CEA) France 2001 Research 2560 8 HPTi Xeon Cluster - Myrinet2000 3.34 Forecast Systems Laboratory - NOAA USA 2002 Research 1536 9 IBM pSeries 690 Turbo 3.16 HPCx UK 2002 Academic 1280 10 IBM pSeries 690 Turbo 3.16 NCAR (National Center for Atmospheric Research) USA 2002 Research 1216

12

Response to the Earth Simulator: Response to the Earth Simulator: IBM Blue Gene/L and ASCI Purple IBM Blue Gene/L and ASCI Purple

♦ Announced 11/19/02

One of 2 machines for LLNL 360 TFlop/s 130,000 proc Linux FY 2005

Plus ASCI Purple IBM Power 5 based 12K proc, 100 TFlop/s

slide-7
SLIDE 7

7

13

DOE ASCI DOE ASCI Red Storm Red Storm Sandia Sandia National Lab National Lab

♦ 10,368 compute processors, 108

cabinets

AMD Opteron @ 2.0 GHz Cray integrator and providing the interconnect ♦ Fully connected high

performance 3-D mesh interconnect.

Topology - 27 X 16 X 24 ♦ Peak of ~ 40 TF Expected MP-Linpack >20 TF ♦ Aggregate system memory

bandwidth - ~55 TB/s

♦ MPI Latency - 2 ms neighbor, 5

ms across machine

♦ Bi-Section bandwidth ~2.3 TB/s ♦ Link bandwidth ~3.0 GB/s in

each direction

2004 in operation

14

TOP500 TOP500 -

  • Performance

Performance

293 TF/s 1.17 TF/s 59.7 GF/s 35.8 TF/s 0.4 GF/s 196 GF/s

Jun-93 Nov-93 Jun-94 Nov-94 Jun-95 Nov-95 Jun-96 Nov-96 Jun-97 Nov-97 Jun-98 Nov-98 Jun-99 Nov-99 Jun-00 Nov-00 Jun-01 Nov-01 Jun-02 Nov-02

Fujitsu 'NWT' NAL NEC ES Intel ASCI Red Sandia IBM ASCI White LLNL

N=1 N=500 SUM

1 Gflop/s 1 Tflop/s 100 Mflop/s 100 Gflop/s 100 Tflop/s 10 Gflop/s 10 Tflop/s 1 Pflop/s

My Laptop

slide-8
SLIDE 8

8

15

Performance Extrapolation Performance Extrapolation

J u n

  • 9

3 J u n

  • 9

4 J u n

  • 9

5 J u n

  • 9

6 J u n

  • 9

7 J u n

  • 9

8 J u n

  • 9

9 J u n

  • J

u n

  • 1

J u n

  • 2

J u n

  • 3

J u n

  • 4

J u n

  • 5

J u n

  • 6

J u n

  • 7

J u n

  • 8

J u n

  • 9

J u n

  • 1

N=1 N=500 Sum

1 GFlop/s 1 TFlop/s 1 PFlop/s 100 MFlop/s 100 GFlop/s 100 TFlop/s 10 GFlop/s 10 TFlop/s 10 PFlop/s

PFlop/s computer TFlop/s To enter the list

Earth Simulator

Blue Gene 130,000 proc ASCI P 12,544 proc

16

Performance Extrapolation Performance Extrapolation

J u n

  • 9

3 J u n

  • 9

4 J u n

  • 9

5 J u n

  • 9

6 J u n

  • 9

7 J u n

  • 9

8 J u n

  • 9

9 J u n

  • J

u n

  • 1

J u n

  • 2

J u n

  • 3

J u n

  • 4

J u n

  • 5

J u n

  • 6

J u n

  • 7

J u n

  • 8

J u n

  • 9

J u n

  • 1

N=1 N=500 Sum

1 GFlop/s 1 TFlop/s 1 PFlop/s 100 MFlop/s 100 GFlop/s 100 TFlop/s 10 GFlop/s 10 TFlop/s 10 PFlop/s

My Laptop

Blue Gene 130,000 proc ASCI P 12,544 proc

slide-9
SLIDE 9

9

17

Architectures Architectures

Single Processor

SMP MPP SIMD

Constellation

Cluster - NOW

100 200 300 400 500 J u n

  • 9

3 N

  • v
  • 9

3 J u n

  • 9

4 N

  • v
  • 9

4 J u n

  • 9

5 N

  • v
  • 9

5 J u n

  • 9

6 N

  • v
  • 9

6 J u n

  • 9

7 N

  • v
  • 9

7 J u n

  • 9

8 N

  • v
  • 9

8 J u n

  • 9

9 N

  • v
  • 9

9 J u n

  • N
  • v
  • J

u n

  • 1

N

  • v
  • 1

J u n

  • 2

Y-MP C90 Sun HPC Paragon CM5 T3D T3E SP2 Cluster of Sun HPC ASCI Red CM2 VP500 SX3

Constellation: # of p/n n

18

93 Clusters on the Top500 93 Clusters on the Top500

♦ A total of 56 Intel based and 8 AMD

based PC clusters are in the TOP500.

31 of these Intel based cluster are IBM Netfinity systems delivered by IBM. ♦ A substantial part of these are installed

at industrial customers especially in the

  • il-industry.

Including 5 Sun and 5 Alpha based clusters and 21 HP AlphaServer. ♦ 15 of these clusters are labeled as

'Self-Made'.

slide-10
SLIDE 10

10

19

Cluster on the Top500 Cluster on the Top500

10 20 30 40 50 60 70 80 90 100 Jun-97 Nov-97 Jun-98 Nov-98 Jun-99 Nov-99 Jun-00 Nov-00 Jun-01 Nov-01 Jun-02 Nov-02 AMD Intel IBM Netfinity Alpha HP Alpha Server Sparc

Processor Breakdown for the 93 Clusters

Pentium III, 28, 30% Sparc, 4, 4% Itanium, 4, 4% AMD, 8, 9% Alpha, 25, 27% Pentium 4, 24, 26% 20

Linux: Plotting The Future Linux: Plotting The Future

slide-11
SLIDE 11

11

21

Linux: Plotting The Future Linux: Plotting The Future

22

Predicting Future Market Share Predicting Future Market Share

How Long Until Total World Domination? How Long Until Total World Domination?

slide-12
SLIDE 12

12

23

How Large Can Linux Clusters Get? How Large Can Linux Clusters Get?

24

Linux Cluster Sizes: Plotting The Future Linux Cluster Sizes: Plotting The Future

slide-13
SLIDE 13

13

25

Observations Observations

♦ The adoption rate of Linux HPC is

phenomenal!

Linux in the Top500 is doubling every 12 months Linux adoption is not driven by bottom feeders

Adoption is actually faster at the ultra-scale!

♦ The CPU counts for the largest Linux

clusters are currently doubling every year

♦ Prediction: by 2005, we will have a 10,000

CPU Linux cluster

♦ Prediction: by 2005, most top-performing

supercomputers will be running Linux

♦ Adoption rate driven largely by economics

and human factors

26

Distributed and Parallel Systems Distributed and Parallel Systems

Distributed systems hetero- geneous Massively parallel systems homo- geneous

Grid based Computing

Google Network of ws

Clusters w/ special interconnect

Entropia/UD Earth Simulator

Gather (unused) resources

Steal cycles

System SW manages resources

System SW adds value

10% - 20% overhead is OK

Resources drive applications

Time to completion is not critical

Time-shared

SETI@home

  • ~ 500,000 machines
  • Averaging 55 Tflop/s

Bounded set of resources

Apps grow to consume all cycles

Application manages resources

System SW gets in the way

5% overhead is maximum

Apps drive purchase of equipment

Real-time constraints

Space-shared

Earth Simulator

  • 5000 processors
  • Averaging 35 Tflop/s

SETI@home Parallel Dist mem ASCI Tflop/s

slide-14
SLIDE 14

14

27

SETI@home SETI@home: Global Distributed Computing : Global Distributed Computing

♦ Running on 500,000 PCs, ~1300 CPU

Years per Day

1.3M CPU Years so far

♦ Sophisticated Data & Signal

Processing Analysis

♦ Distributes Datasets from Arecibo

Radio Telescope

28

SETI@home SETI@home

♦ Use thousands of Internet-

connected PCs to help in the search for extraterrestrial intelligence.

♦ When their computer is idle

  • r being wasted this

software will download ~ half a MB chunk of data for analysis. Performs about 3 Tflops for each client in 15 hours.

♦ The results of this analysis

are sent back to the SETI team, combined with thousands of other participants.

♦ Largest distributed

computation project in existence

Averaging 55 Tflop/s ♦ Today a number of

companies trying this for profit.

slide-15
SLIDE 15

15

29

Grid Computing Grid Computing -

  • from ET to

from ET to Smallpox Smallpox

The project employs computational chemistry to analyze chemical interactions between a library of 35 million potential drug molecules and several protein targets on the smallpox virus in the search for an effective anti-viral drug to treat smallpox post-infection.

30

♦ Google query attributes

150M queries/day (2000/second) 100 countries 3B documents in the index

♦ Data centers

15,000 Linux systems in 6 data centers

15 TFlop/s and 1000 TB total capability 40-80 1U/2U servers/cabinet 100 MB Ethernet switches/cabinet with gigabit Ethernet uplink

growth from 4,000 systems (June 2000)

18M queries then

♦ Performance and operation

simple reissue of failed commands to new servers no performance debugging

Source: Monika Henzinger, Google

slide-16
SLIDE 16

16

31

♦ Today there is a complex interplay and

increasing interdependence among the sciences.

♦ Many science and engineering problems require

widely dispersed resources be operated as systems.

♦ What we do as collaborative infrastructure

developers will have profound influence on the future of science.

♦ Networking, distributed computing, and parallel

computation research have matured to make it possible for distributed systems to support high- performance applications, but...

Resources are dispersed Connectivity is variable Dedicated access may not be possible

In the past: Isolation Motivation for Grid Computing Motivation for Grid Computing

Today: Collaboration

32

The Grid

slide-17
SLIDE 17

17

33

IPG NASA http://nas.nasa.gov/~wej/home/IPG Globus http://www.globus.org/ Legion http://www.cs.virgina.edu/~grimshaw/ AppLeS http://www-cse.ucsd.edu/groups/hpcl/ NetSolve http://www.cs.utk.edu/netsolve/ NINF http://phase.etl.go.jp/ninf/ Condor http://www.cs.wisc.edu/condor/ CUMULVS http://www.epm.ornl.gov/cs/ WebFlow http://www.npac.syr.edu/users/gcf/ NGC http://www.nordicgrid.net

Grids are Hot Grids are Hot

34

University of Tennessee Deployment: University of Tennessee Deployment: S Scalable calable In Intracampus tracampus R Research esearch G Grid: rid: SInRG SInRG

Federated Ownership: CS, Chem Eng., Medical School, Computational Ecology, El. Eng.

Real applications, middleware development, logistical networking

The Knoxville Campus has two DS-3 commodity Internet connections and one DS-3 Internet2/Abilene connection. An OC-3 ATM link routes IP traffic between the Knoxville campus, National Transportation Research Center, and Oak Ridge National Laboratory. UT participates in several national networking initiatives including Internet2 (I2), Abilene, the federal Next Generation Internet (NGI) initiative, Southern Universities Research Association (SURA) Regional Information Infrastructure (RII), and Southern Crossroads (SoX). The UT campus consists of a meshed ATM OC-12 being migrated over to switched Gigabit by early 2002.

slide-18
SLIDE 18

18

35

Grids vs. Capability Computing Grids vs. Capability Computing

♦ Not an “either/or” question Each addresses different needs Both are part of an integrated solution ♦ Grid strengths Coupling necessarily distributed resources

instruments, software, hardware, archives, and people

Eliminating time and space barriers

remote resource access and capacity computing

Grids are not a cheap substitute for capability HPC ♦ Capability computing strengths Supporting foundational computations

terascale and petascale “nation scale” problems

Engaging tightly coupled teams and computations

36

Futures for Numerical Algorithms and Software Futures for Numerical Algorithms and Software

♦ Numerical software will be adaptive, exploratory,

and intelligent

♦ Determinism in numerical computing will be gone.

  • After all, its not reasonable to ask for exactness in numerical computations.

Auditability of the computation, reproducibility at a cost

♦ Fault Tolerance

Google claims 15K nodes, what do they do when one goes down? We must do better than “restart ALL nodes from last chkpt”

♦ Importance of floating point arithmetic will be

undiminished.

16, 32, 64, 128 bits and beyond.

♦ Reproducibility, fault tolerance, and auditability ♦ Adaptivity is a key so applications can

effectively use the resources.

slide-19
SLIDE 19

19

37

Collaborators / Support Collaborators / Support

♦ TOP500

  • H. Mauer, Mannheim U
  • H. Mauer, Mannheim U
  • H. Simon, NERSC
  • H. Simon, NERSC
  • E. Strohmaier, NERSC
  • E. Strohmaier, NERSC

Thanks

NSF Next Generation Software