An Overview of High Performance An Overview of High Performance - - PDF document

an overview of high performance an overview of high
SMART_READER_LITE
LIVE PREVIEW

An Overview of High Performance An Overview of High Performance - - PDF document

An Overview of High Performance An Overview of High Performance Computing, Clusters, and the Grid Computing, Clusters, and the Grid Jack Dongarra University of Tennessee and Oak Ridge National Laboratory 1 Technology Trends: Technology


slide-1
SLIDE 1

1

1

An Overview of High Performance An Overview of High Performance Computing, Clusters, and the Grid Computing, Clusters, and the Grid

Jack Dongarra University of Tennessee and Oak Ridge National Laboratory

2

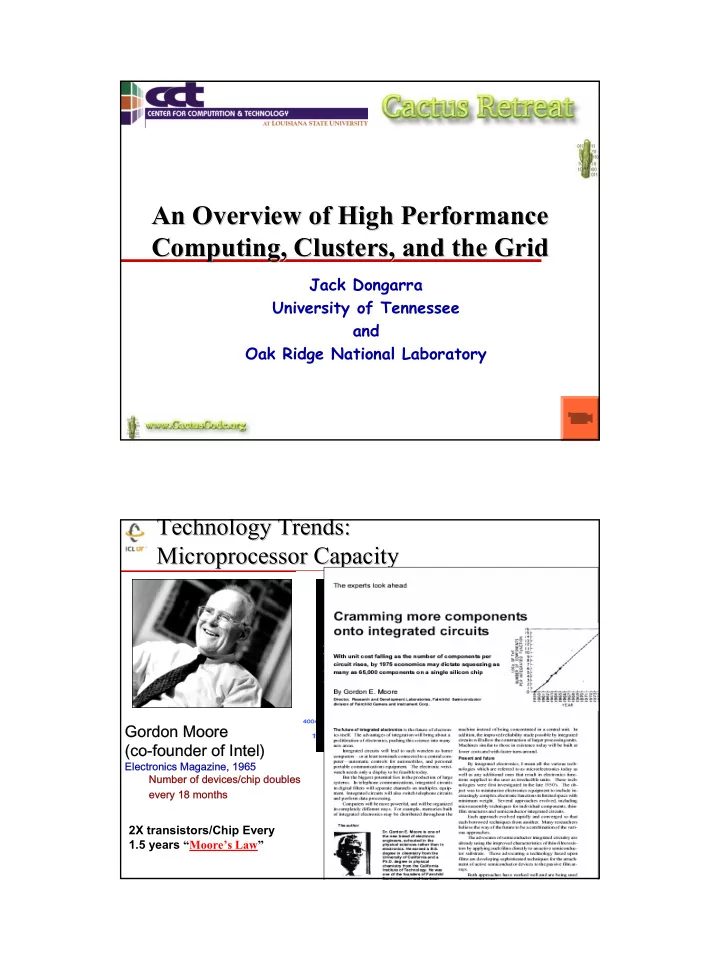
Technology Trends: Technology Trends: Microprocessor Capacity Microprocessor Capacity

2X transistors/Chip Every 1.5 years “Moore’s Law”

Microprocessors have become smaller, denser, and more powerful. Not just processors, bandwidth, storage, etc. 2X memory and processor speed and ½ size, cost, & power every 18 months.

Gordon Moore (co-founder of Intel)

Electronics Magazine, 1965 Number of devices/chip doubles every 18 months

slide-2
SLIDE 2

2

3 Earth Simulator ASCI White Pacific EDSAC 1 UNIVAC 1 IBM 7090 CDC 6600 IBM 360/195 CDC 7600 Cray 1 Cray X-MP Cray 2 TMC CM-2 TMC CM-5 Cray T3D ASCI Red

1950 1960 1970 1980 1990 2000 2010 1 KFlop/s 1 MFlop/s 1 GFlop/s 1 TFlop/s 1 PFlop/s

Scalar Super Scalar Vector Parallel Super Scalar/Vector/Parallel

Moore Moore’ ’s Law s Law

1941 1 (Floating Point operations / second, Flop/s) 1945 100 1949 1,000 (1 KiloFlop/s, KFlop/s) 1951 10,000 1961 100,000 1964 1,000,000 (1 MegaFlop/s, MFlop/s) 1968 10,000,000 1975 100,000,000 1987 1,000,000,000 (1 GigaFlop/s, GFlop/s) 1992 10,000,000,000 1993 100,000,000,000 1997 1,000,000,000,000 (1 TeraFlop/s, TFlop/s) 2000 10,000,000,000,000 2003 35,000,000,000,000 (35 TFlop/s)

(103) (106) (109) (1012) (1015)

4

  • H. Meuer, H. Simon, E. Strohmaier, & JD
  • H. Meuer, H. Simon, E. Strohmaier, & JD
  • Listing of the 500 most powerful

Computers in the World

  • Yardstick: Rmax from LINPACK MPP

Ax=b, dense problem

  • Updated twice a year

SC‘xy in the States in November Meeting in Mannheim, Germany in June

  • All data available from www.top500.org

Si Size ze Rate Rate

TPP performance PP performance

slide-3
SLIDE 3

3

5

♦ A supercomputer is a

hardware and software system that provides close to the maximum performance that can currently be achieved.

♦ Over the last 10 years the

range for the Top500 has increased greater than Moore’s Law

♦ 1993: #1 = 59.7 GFlop/s #500 = 422 MFlop/s ♦ 2003: #1 = 35.8 TFlop/s #500 = 403 GFlop/s

What is a What is a Supercomputer? Supercomputer?

Why do we need them? Computational fluid dynamics, protein folding, climate modeling, national security, in particular for cryptanalysis and for simulating nuclear weapons to name a few.

6

A Tour de Force in Engineering A Tour de Force in Engineering

Homogeneous, Centralized, Proprietary, Expensive!

Target Application: CFD-Weather, Climate, Earthquakes

640 NEC SX/6 Nodes (mod)

5120 CPUs which have vector ops Each CPU 8 Gflop/s Peak ♦

40 TFlop/s (peak)

~ 1/2 Billion $ for machine, software, & building

Footprint of 4 tennis courts

7 MWatts

Say 10 cent/KWhr - $16.8K/day = $6M/year! ♦

Expect to be on top of Top500 until 60-100 TFlop ASCI machine arrives

From the Top500 (November 2003) Performance of ESC > Σ Next Top 3 Computers

slide-4
SLIDE 4

4

7

November 2003 November 2003

9.216 1920 2003 Lawrence Livermore National Laboratory Livermore 6.59 xSeries Cluster Xeon 2.4 GHz – w/Quadrics IBM 10 9.984 6656 2002 NERSC/LBNL Berkeley 7.30 SP Power3 375 MHz 16 way IBM 9 12.29 8192 2000 Lawrence Livermore National Laboratory Livermore 7.30 ASCI White, Sp Power3 375 MHz IBM 8 11.06 2304 2002 Lawrence Livermore National Laboratory Livermore 7.63 MCR Linux Cluster Xeon 2.4 GHz – w/Quadrics Linux NetworX 7 11.26 2816 2003 Lawrence Livermore National Laboratory Livermore 8.05 Opteron 2 GHz, w/Myrinet Linux NetworX 6 11.62 1936 2003 Pacific Northwest National Laboratory Richland 8.63 rx2600 Itanium2 1 GHz Cluster – w/Quadrics Hewlett- Packard 5 15.30 2500 2003 University of Illinois U/C Urbana/Champaign 9.82 PowerEdge 1750 P4 Xeon 3.6 Ghz w/Myrinet Dell 4 17.60 2200 2003 Virginia Tech Blacksburg, VA 10.3 Apple G5 Power PC w/Infiniband 4X Self 3 20.48 8192 2002 Los Alamos National Laboratory Los Alamos 13.9 ASCI Q - AlphaServer SC ES45/1.25 GHz Hewlett- Packard 2 40.90 5120 2002 Earth Simulator Center Yokohama 35.8 Earth-Simulator NEC 1 Rpeak Tflop/s # Proc Year Installation Site Rmax Tflop/s Computer Manufacturer

50% of top500 performance in top 9 machines; 131 system > 1 TFlop/s; 210 machines are clusters 8

TOP500 TOP500 – – Performance Performance -

  • Nov 2003

Nov 2003

1.17 TF/s 528 TF/s 35.8 TF/s 59.7 GF/s 403 GF/s 0.4 GF/s

J u n

  • 9

3 J u n

  • 9

4 J u n

  • 9

5 J u n

  • 9

6 J u n

  • 9

7 J u n

  • 9

8 J u n

  • 9

9 J u n

  • J

u n

  • 1

J u n

  • 2

J u n

  • 3

Fujitsu 'NWT' NAL NEC ES Intel ASCI Red Sandia IBM ASCI White LLNL

N=1 N=500 SUM

1 Gflop/s 1 Tflop/s 100 Mflop/s 100 Gflop/s 100 Tflop/s 10 Gflop/s 10 Tflop/s 1 Pflop/s

My Laptop (1015) (1012)

(109)

slide-5
SLIDE 5

5

9

Number of Systems on Top500 > 1 Number of Systems on Top500 > 1 Tflop/s Tflop/s Over Time Over Time

1 1 1 1 2 3 5 7 12 17 23 46 59 131 20 40 60 80 100 120 140 N ov-96 M ay-97 N ov-97 M ay-98 N ov-98 M ay-99 N ov-99 M ay-00 N ov-00 M ay-01 N ov-01 M ay-02 N ov-02 M ay-03 N ov-03 M ay-04

Since 1998 ~ doubling every 2 years

10 Year of Introduction for 131Systems > 1 TFlop/s

1 3 3 7 31 86 20 40 60 80 100 1998 1999 2000 2001 2002 2003

Factoids on Machines > 1 Factoids on Machines > 1 TFlop/s TFlop/s

♦ 131 Systems ♦ 80 Clusters (61%) ♦ Average rate: 2.44 Tflop/s ♦ Median rate: 1.55 Tflop/s ♦ Sum of processors in Top131:

155,161

Sum for Top500: 267,789 ♦ Average processor count: 1184 ♦ Median processor count: 706 ♦ Numbers of processors Most number of processors: 963226

ASCI Red

Fewest number of processors: 12471

Cray X1

Number of processors

100 1000 10000 1 21 41 61 81 101 121 Rank Num ber of processors

slide-6
SLIDE 6

6

11

Percent Of 131 Systems Which Use The Percent Of 131 Systems Which Use The Following Processors > 1 Following Processors > 1 TFlop/s TFlop/s

IBM 24% Pentium 48% Itanium 9% Alpha 6% AMD 2% Cray 4% Fujitsu Sparc 1% Hitachi 2% NEC 3% SGI 1%

About a half are based on 32 bit architecture 9 (11) Machines have a Vector instruction Sets

Cut of the data distorts manufacture counts, ie HP(14), IBM > 24%

Cut by Manufacture of System

IBM 52% Dell 5% NEC 3% Self-made 5% Fujitsu 1% Hitachi 2% Promicro 2% HPTi 1% Intel 1% Atipa Technology 1% Visual Technology 1% Legend Group 2% Linux Networx 5% SGI 5% Cray Inc. 4% HP 10% 12

What About Efficiency? What About Efficiency?

♦ Talking about Linpack ♦ What should be the efficiency of a machine

  • n the Top131 be?

Percent of peak for Linpack > 90% ? > 80% ? > 70% ? > 60% ? … ♦ Remember this is O(n3) ops and O(n2) data Mostly matrix multiply

slide-7
SLIDE 7

7

13

Efficiency of Systems > 1 Tflop/s

0.1 0.2 0.3 0.4 0.5 0.6 0.7 0.8 0.9 1 1 21 41 61 81 101 121 Rank Efficency AMD Cray X1 Alpha IBM Hitachi NEC SX Pentium Sparc Itanium SGI

1000 10000 100000 1 21 41 61 81 101 121 Rank

Rank Performance

ES ASCI Q VT-Apple NCSA PNNL LANL Lighting LLNL MCR ASCI White NERSC LLNL (6.6)

_

14

♦ Gig Ethernet ♦ Myrinet ♦ Infiniband ♦ QsNet ♦ SCI

Clos F a t t r e e T

  • r

u s

Commodity Interconnects Commodity Interconnects

Switch topology $ NIC $Sw/node $ Node Lt(us)/BW (MB/s) (MPI) Gigabit Ethernet Bus $ 50 $ 50 $ 100 30 / 100 SCI Torus $1,600 $ 0 $1,600 5 / 300 QsNetII Fat Tree $1,200 $1,700 $2,900 3 / 880 Myrinet (D card) Clos $ 700 $ 400 $1,100 6.5/ 240 IB 4x Fat Tree $1,000 $ 400 $1,400 6 / 820

slide-8
SLIDE 8

8

15

Efficency of Systems > 1 TFlop/s

0.1 0.2 0.3 0.4 0.5 0.6 0.7 0.8 0.9 1 1 21 41 61 81 101 121 Rank Efficency gigE Infiniband Myrinet Quadrics Proprietary SCI

ES ASCI Q VT-Apple NCSA PNNL LANL Lighting LLNL MCR ASCI White NERSC LLNL

44 3 19 12 1 52 16 Myrinet 15% GigE 34% Infiniband 2% Quadrics 9% Proprietary 39% SCI 1%

Interconnects Used Interconnects Used

Largest node count min max average GigE 1024 17% 63% 37% SCI 120 64% 64% 64% QsNetII 2000 68% 78% 74% Myrinet 1250 36% 79% 59% Infiniband 4x 1100 58% 69% 64% Proprietary 9632 45% 98% 68%

Efficiency for Efficiency for Linpack Linpack

slide-9
SLIDE 9

9

17

Country Percent by Total Performance Country Percent by Total Performance

United States 63% Korea, South 1% Malaysia 0% Mexico 1% Japan 15% Netherlands 1% New Zealand 1% Sweden 0% Saudia Arabia 0% Switzerland 0% United Kingdom 5% India 0% Italy 1% Israel 0% Germany 3% France 3% Finland 0% China 2% Canada 2% Australia 0%

18

KFlop/s KFlop/s per Capita (Flops/Pop) per Capita (Flops/Pop)

100 200 300 400 500 600 700 800 900 1000 I n d i a C h i n a M e x i c

  • M

a l a y s i a S a u d i a A r a b i a I t a l y A u s t r a l i a K

  • r

e a , S

  • u

t h N e t h e r l a n d s G e r m a n y S w e d e n F r a n c e S w i t z e r l a n d C a n a d a I s r a e l F i n l a n d U n i t e d K i n g d

  • m

J a p a n U n i t e d S t a t e s N e w Z e a l a n d

WETA Digital (Lord of the Rings)

slide-10
SLIDE 10

10

19

A Tool and A Market for Every Task A Tool and A Market for Every Task

Capability

  • Each targets different applications
  • understand application needs

200K Honda units at 5 KW to equal a 1 GW nuclear plant

20

Taxonomy Taxonomy

♦ Special purpose processors

and interconnect

♦ High Bandwidth, low

latency communication

♦ Designed for scientific

computing

♦ Relatively few machines will

be sold

♦ High price ♦ Commodity processors and

switch

♦ Processors design point

for web servers & home pc’s

♦ Leverage millions of

processors

♦ Price point appears

attractive for scientific computing

Capability Computing Cluster Computing

slide-11
SLIDE 11

11

21

High Bandwidth High Bandwidth vs vs Commodity Systems Commodity Systems

♦ High bandwidth systems have traditionally been vector

computers

Designed for scientific problems Capability computing ♦ Commodity processors are designed for web servers and the

home PC market

(should be thankful that the manufactures keep the 64 bit fl pt) Used for cluster based computers leveraging price point ♦ Scientific computing needs are different Require a better balance between data movement and floating point operations. Results in greater efficiency.

Earth Simulator Cray X1 ASCI Q MCR VT Big Mac (NEC) (Cray) (HP EV68) (Dual Xeon) (Dual IBM PPC) Year of Introduction 2002 2003 2002 2002 2003 Node Architecture Vector Vector Alpha Pentium Power PC Processor Cycle Time 500 MHz 800 MHz 1.25 GHz 2.4 GHz 2 GHz Peak Speed per Processor 8 Gflop/s 12.8 Gflop/s 2.5 Gflop/s 4.8 Gflop/s 8 Gflop/s Bytes/flop (main memory) 4 2.6 0.8 0.44 0.5 22

Phases I Phases I -

  • III

III

02 05 06 07 08 09 10 03 04 Products Metrics, Benchmarks Academia Research Platforms Early Software Tools Early Pilot Platforms

Phase II R&D

3 companies ~$50M each

Phase III Full Scale Development

co comme mmercia rcially re ready i in t the 2007 2007 to 2010 t 2010 time mefra frame. $10 $100M ? 0M ? Metrics and Benchmarks System Design Review

Industry Application Analysis Performance Assessment HPCS Capability or Products

Fiscal Year Concept Reviews PDR Research Prototypes & Pilot Systems Phase III Readiness Review Technology Assessments Requirements and Metrics Phase II Readiness Reviews

Phase I Industry Concept Study

5 companies $10M each Reviews Industry Procurements Critical Program Milestones DDR

slide-12
SLIDE 12

12

23

Performance Extrapolation Performance Extrapolation

J u n

  • 9

3 J u n

  • 9

4 J u n

  • 9

5 J u n

  • 9

6 J u n

  • 9

7 J u n

  • 9

8 J u n

  • 9

9 J u n

  • J

u n

  • 1

J u n

  • 2

J u n

  • 3

J u n

  • 4

J u n

  • 5

J u n

  • 6

J u n

  • 7

J u n

  • 8

J u n

  • 9

J u n

  • 1

N=1 N=500 Sum

1 GFlop/s 1 TFlop/s 1 PFlop/s 100 MFlop/s 100 GFlop/s 100 TFlop/s 10 GFlop/s 10 TFlop/s 10 PFlop/s

TFlop/s To enter the list PFlop/s Computer

Blue Gene 130,000 proc ASCI P 12,544 proc

1015 1012

24

Performance Extrapolation Performance Extrapolation

J u n

  • 9

3 J u n

  • 9

4 J u n

  • 9

5 J u n

  • 9

6 J u n

  • 9

7 J u n

  • 9

8 J u n

  • 9

9 J u n

  • J

u n

  • 1

J u n

  • 2

J u n

  • 3

J u n

  • 4

J u n

  • 5

J u n

  • 6

J u n

  • 7

J u n

  • 8

J u n

  • 9

J u n

  • 1

N=1 N=500 Sum

1 GFlop/s 1 TFlop/s 1 PFlop/s 100 MFlop/s 100 GFlop/s 100 TFlop/s 10 GFlop/s 10 TFlop/s 10 PFlop/s

My Laptop

Blue Gene 130,000 proc ASCI P 12,544 proc

1015 1012 109

slide-13
SLIDE 13

13

25

ASCI Purple & IBM Blue Gene/L ASCI Purple & IBM Blue Gene/L

♦ Announced 11/19/02

One of 2 machines for LLNL 360 TFlop/s 130,000 proc Linux FY 2005 Preliminary machine

IBM Research BlueGene/L

PowerPC 440, 500MHz w/custom proc/interconnect 512 Nodes (1024 processors) 1.435 Tflop/s (2.05 Tflop/s Peak)

Plus ASCI Purple IBM Power 5 based 12K proc, 100 TFlop/s

26

SETI@home SETI@home: Global Distributed Computing : Global Distributed Computing

♦ Running on 500,000 PCs, ~1300 CPU

Years per Day

1.3M CPU Years so far

♦ Sophisticated Data & Signal

Processing Analysis

♦ Distributes Datasets from Arecibo

Radio Telescope

slide-14
SLIDE 14

14

27

SETI@home SETI@home

♦ Use thousands of Internet-

connected PCs to help in the search for extraterrestrial intelligence.

♦ When their computer is idle

  • r being wasted this

software will download ~ half a MB chunk of data for analysis. Performs about 3 Tflops for each client in 15 hours.

♦ The results of this analysis

are sent back to the SETI team, combined with thousands of other participants.

♦ About 5M users

♦ Largest distributed

computation project in existence

Averaging 72 Tflop/s

28 ♦

Google query attributes

150M queries/day (2000/second) 100 countries 3.3B documents in the index

Data centers

100,000 Linux systems in data centers around the world

15 TFlop/s and 1000 TB total capability 40-80 1U/2U servers/cabinet 100 MB Ethernet switches/cabinet with gigabit Ethernet uplink

growth from 4,000 systems (June 2000)

18M queries then

Performance and operation simple reissue of failed commands to new servers no performance debugging

  • problems are not reproducible

Source: Monika Henzinger, Google & Cleve Moler

Forward link are referred to in the rows Back links are referred to in the columns

Eigenvalue problem n=3.3x10⁹ (see: MathWorks Cleve’s Corner)

slide-15
SLIDE 15

15

29

Science and Technology Science and Technology

♦ Today, large science projects are

conducted by global teams using sophisticated combinations of

Computers Networks Visualization Data storage Remote instruments People Other resources

Information Infrastructure provides a way to integrate resources to support modern applications

30

Grid Computing is About Grid Computing is About … …

Resource sharing & coordinated problem solving in dynamic, multi-institutional virtual

  • rganizations
QuickTime™ and a decompressor are needed to see this picture. QuickTime™ and a decompressor are needed to see this picture.

IMAGING INSTRUMENTS COMPUTATIONAL RESOURCES LARGE-SCALE DATABASES DATA ACQUISITION ,ANALYSIS ADVANCED VISUALIZATION

The most pressing scientific challenges require application solutions that are multidisciplinary and multi-scale.

slide-16
SLIDE 16

16

31

The Grid The Grid

♦ Motivation: When communication is close to

free we should not be restricted to local resources when solving problems.

♦ Infrastructure that builds on the Internet and

the Web

♦ Enable and exploit large scale sharing of

resources

♦ Virtual organization

Loosely coordinated groups

♦ Provides for remote access of resources

Scalable Secure Reliable mechanisms for discovery and access

32

Grid Software Challenges Grid Software Challenges

♦ Simplified programming

reduced complexity and coordination

♦ Accounting and resource economies

“non-traditional” resources and concurrency

shared resource costs and denial of service

negotiation and equilibration

exchange rates and sharing

♦ Scheduling and adaptation

performance, fault-tolerance, and access

networks, computing, storage, and sensors

♦ On-demand access

unique observational events and sensor fusion

“instant” access and nimble scheduling

♦ Managing bandwidth and latency

lambda dominance and exploitation

slide-17
SLIDE 17

17

33

The Grid

34

Science Grid Projects Science Grid Projects

slide-18
SLIDE 18

18

35

TeraGrid 2003 TeraGrid 2003

Prototype for a National Cyberinfrastructure Prototype for a National Cyberinfrastructure

40 G 40 Gb/s /s 20 G 20 Gb/s /s 30 G 30 Gb/s /s 10 G 10 Gb/s /s 10 G 10 Gb/s /s

36

KEK Operation (NII)

  • U. of Tokyo

NIG ISAS Nagoya U. Kyoto U. Osaka U.

DataGRID for High-energy Science Computational GRID and NAREGI Nano-Technology For GRID Application OC-48+ transmission for Radio Telescope Bio-Informatics

NIFS Kyushu U.

Hokkaido U.

Okazaki Research Institutes

Tohoku U.

Tsukuba U. Tokyo Institute of Tech. Waseda U. Doshidha U. NAO NII R&D

SuperSINET and Applications

slide-19
SLIDE 19

19

37

University of Tennessee Deployment: University of Tennessee Deployment: S Scalable calable In Intracampus tracampus R Research esearch G Grid: rid: SInRG SInRG

Federated Ownership: CS, Chem Eng., Medical School, Computational Ecology, El. Eng.

Real applications, middleware development, logistical networking

The Knoxville Campus has two DS-3 commodity Internet connections and one DS-3 Internet2/Abilene connection. An OC-3 ATM link routes IP traffic between the Knoxville campus, National Transportation Research Center, and Oak Ridge National Laboratory. UT participates in several national networking initiatives including Internet2 (I2), Abilene, the federal Next Generation Internet (NGI) initiative, Southern Universities Research Association (SURA) Regional Information Infrastructure (RII), and Southern Crossroads (SoX). The UT campus consists of a meshed ATM OC-12 being migrated over to switched Gigabit by early 2002.

38

Atmospheric Sciences Grid Atmospheric Sciences Grid

Real time data

Data Fusion General Circulation model Regional weather model Photo-chemical pollution model Particle dispersion model Topography Database Topography Database Vegetation Database Vegetation Database Bushfire model Emissions Inventory Emissions Inventory

slide-20
SLIDE 20

20

39

Standard Implementation Standard Implementation

GASS

Real time data

Data Fusion General Circulation model Regional weather model Photo-chemical pollution model Particle dispersion model Topography Database Topography Database Vegetation Database Vegetation Database Emissions Inventory Emissions Inventory

MPI MPI

MPI

GASS/GridFTP/GRC

MPI MPI

Bushfire model GASS

Change Models

40

Are Plants Doing Grid Computing? Are Plants Doing Grid Computing?

slide-21
SLIDE 21

21

41

The Computing Continuum The Computing Continuum

♦ Each strikes a different balance

computation/communication coupling

♦ Implications for execution efficiency ♦ Applications for diverse needs

computing is only one part of the story!

Loosely Coupled Tightly Coupled

Clusters Highly Parallel “Grids”

Special Purpose “SETI / Google”

42

Grids vs. Capability vs. Cluster Computing Grids vs. Capability vs. Cluster Computing

♦ Not an “either/or” question

Each addresses different needs Each are part of an integrated solution

♦ Grid strengths

Coupling necessarily distributed resources

instruments, software, hardware, archives, and people

Eliminating time and space barriers

remote resource access and capacity computing

Grids are not a cheap substitute for capability HPC

♦ Capability computing strengths

Supporting foundational computations

terascale and petascale “nation scale” problems

Engaging tightly coupled computations and teams

♦ Clusters

Low cost, group solution Potential hidden costs

♦ Key is easy access to resources in a transparent way

slide-22
SLIDE 22

22

43

Real Crisis With HPC Is With The Real Crisis With HPC Is With The Software Software

♦ Programming is stuck

Arguably hasn’t changed since the 60’s

♦ It’s time for a change

Complexity is rising dramatically

highly parallel and distributed systems

From 10 to 100 to 1000 to 10000 to 100000 of processors!!

multidisciplinary applications

♦ A supercomputer application and software are usually

much more long-lived than a hardware

Hardware life typically five years at most. Fortran and C are the main programming models

♦ Software is a major cost component of modern

technologies.

The tradition in HPC system procurement is to assume that the software is free.

♦ We don’t have many great ideas about how to solve

this problem.

44

Collaborators / Support Collaborators / Support

♦ TOP500

  • H. Meuer, Mannheim U
  • H. Meuer, Mannheim U
  • H. Simon, NERSC
  • H. Simon, NERSC
  • E. Strohmaier, NERSC
  • E. Strohmaier, NERSC