
SLIDE 1
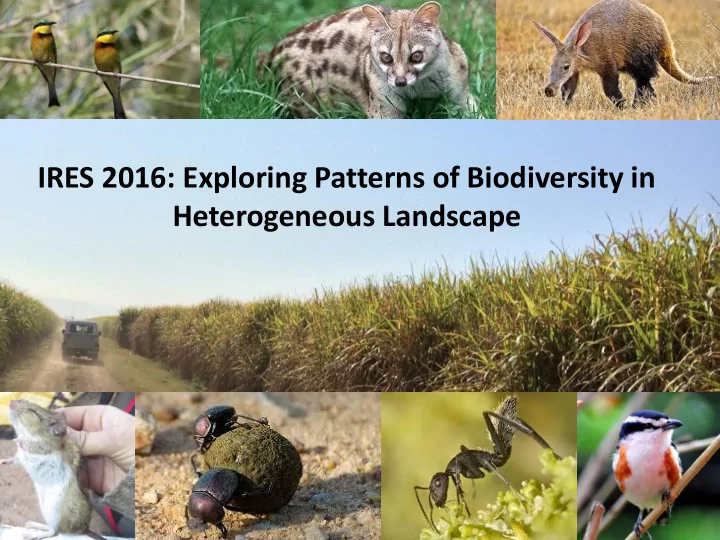
IRES 2016: Exploring Patterns of Biodiversity in Heterogeneous Landscape
Heterogeneous Landscape International Research Experience for - - PowerPoint PPT Presentation
IRES 2016: Exploring Patterns of Biodiversity in Heterogeneous Landscape International Research Experience for Students UNIVERSITY OF SWAZILAND Balancing Biodiversity and Agriculture Is heterogeneity the answer? Heterogeneity Hypothesis High
IRES 2016: Exploring Patterns of Biodiversity in Heterogeneous Landscape
International Research Experience for Students
UNIVERSITY OF SWAZILAND
Balancing Biodiversity and Agriculture Is heterogeneity the answer?
Heterogeneity Hypothesis
Low High Biodiversity
What about biodiversity & landscape heterogeneity?
Components of Landscape Heterogeneity
Fahrig et al. 2011
Low Composition Low Configuration High Composition High Configuration High Composition Low Configuration Low Composition High Configuration
Objectives
Testing the landscape heterogeneity hypothesis
Agriculture Riparian/Forest Closed savanna Communal lands Open savanna Water
2 km
Low Composition Low Configuration High Composition Low Configuration High Composition High Configuration
Testing the landscape heterogeneity hypothesis
Agriculture Riparian/Forest Closed savanna Communal lands Open savanna Water
2 km
Low Composition Low Configuration High Composition Low Configuration High Composition High Configuration
! ! ! ! ! ! ! ! ! ! ! ! ! ! ! !
15 Study Sites
Biodiversity sampling across multiple taxonomic groups
500 m 50 m
Vegetation structural heterogeneity
The alternative or complementary hypothesis for explaining patterns of diversity
Tree height & Cover Grass biomass Shrub cover
Landscapes of biodiversity
disturbance (Cole et al. 2002)
environmental change (Murphy et al. 1990)
vertebrate and invertebrate diversity (Pearson and Cassola 1992)
What are the questions to ask?
https://www.illovosugar.co.za/UserContent/images/News-Articles/Pg26b.png
By ProfessorX. - Own work. Uploaded by ProfessorX, Public Domain, https://commons.wikimedia.org/w/index.php?curid=282227Land Use: Vegetation:
Aerial View
and by morphospecies
without
Dun Beetle Trap: Massimiliano Bisceglie and Yen Yi Tan
1687 beetles representing 43 species were captured 69 of 75 plots had at least 1 beetle Morphospecies 2 was the most common beetle (n = 709) Six species had only 1 beetle, and 23 had under 10 beetles Maximum beetles per plot: 105 Maximum of one species: 89
within 2km of the site
Within 2km Within 2km
within 2km of the site Important: Land use types
pesticides
large patches of agriculture
reserves, distance from agriculture to maintain biodiversity
Alison Ke, UC Berkeley
alisonke@berkeley.edu
environment
White-bellied Sunbird Dark-capped Bulbul Red-faced Mousebird
Prediction: Yes Alternative: Land-use drives bird diversity
2755 individuals 83 species
–4 endemic –2 near-endemic
After 320 point counts:
Landscape composition drives diversity
Species Diversity Land Cover Diversity Species Diversity Proportion of Agriculture
Land-use drives diversity
Effect of agriculture Landscape scale response
Proportion of Agriculture Species Diversity .25
Species Response to Heterogeneity at Different Scales
Celine Carneiro IRES 2016
Black-backed Jackal Large-spotted Genet 15 – 20 km2 2 – 5 km2
What scale of heterogeneity is most influential on
1) Landscape-level heterogeneity Jackal presence edge agriculture 2) Fine-scale heterogeneity Genet presence canopy cover and shrub cover
Sampling
Results
Black-backed Jackal Large-spotted Genet
5 5.1 5.2 5.3 5.4 5.5 5.6 5.7 5.8
Patch Cohesion Present Absent
0.5 1 1.5 2 2.5 3 3.5
Grass biomass Present Absent
Species respond to heterogeneity at different scales
What does it mean?
University of Florida Savanna Research Center Nicole Jennings
Small mammals are useful for studying habitat heterogeneity.
Saccostomus campestris (Pouched Mouse) Gerbilliscus leucogaster (Bush Veld Gerbil)
Questions & Predictions
How is diversity affected by vegetation structure at the fine scale? Prediction: grass biomass and shrub cover is most influential Is diversity affected at the broad scale? Prediction: different land cover types influence diversity
Steatomys pratensis (Fat mouse)
Methods
Summary Statistics
19 11 10 6 4 1 1 2 4 6 8 10 12 14 16 18 20
Number of Individuals Species Name Abundance of Each Species
Total of 7,200 trap nights 52 individuals captured
Low sample size
Drought effects
Results
0.5 1 1.5 2 2.5 3 3.5 500 1000 1500 2000 2500
Species Richness Variation in Canopy Cover Species Richness Change to Variance in Canopy Cover
Increase in variance of canopy cover increase in species diversity
Why?
Species diversity not affected at landscape scale
Take Home Message
Heterogeneity is an important factor for small mammal diversity
Low sample size Drought
Grid Level Example
1 = Highest canopy layer diversity ; species diversity 5 = Lowest canopy layer diversity; species diversity
Birds Ants Beetles Carnivores Rodents Fine Broad
Fine scale vs broad scale heterogeneity?
Different taxa respond at different scales
Birds Ants Beetles Carnivores Rodents Comp Config
Landscape compositional vs configurational heterogeneity?
Compositional heterogeneity most influential, but again varied responses
IRES in the future: 2017 & 2018
IRES 2016
“Put me ahead in accomplishing my goals as an ecologist” “Very educational and amazing experience”
Thank you and Questions?
UNIVERSITY OF SWAZILAND
Enthusiastic field crews! Max & Yinny for photos!