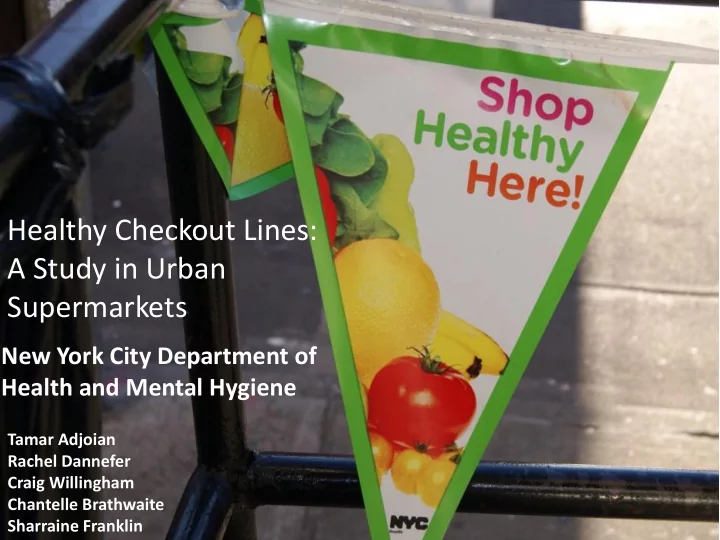
healthy checkout lines
play

Healthy Checkout Lines: A Study in Urban Supermarkets New York - PowerPoint PPT Presentation

Healthy Checkout Lines: A Study in Urban Supermarkets New York City Department of Health and Mental Hygiene Tamar Adjoian Rachel Dannefer Craig Willingham Chantelle Brathwaite Sharraine Franklin Shop Healthy NYC is a neighborhood-based


  1. Healthy Checkout Lines: A Study in Urban Supermarkets New York City Department of Health and Mental Hygiene Tamar Adjoian Rachel Dannefer Craig Willingham Chantelle Brathwaite Sharraine Franklin

  2. Shop Healthy NYC is a neighborhood-based approach that simultaneously addresses supply and demand Suppliers & Distributors Retailers Community Increased neighborhood access to healthy food

  3. Healthy Checkout 2015: Objective To understand the impact of healthy checkouts on consumer behavior at three supermarkets in the South Bronx, New York City.

  4. Healthy Checkout 2015: Study Design/Methods • Consumer purchasing behavior was observed in the summer of 2015 at three supermarkets in the South Bronx • Two checkout lines were selected per store; one converted to a “healthy checkout” and the other left as it was (“standard checkout”) • Signage was posted to identify healthy line

  5. Healthy Checkout 2015: Study Design/Methods • Standard line remained unchanged, no signage posted • 2 weeks, 3-hour shifts, 3 days/week • Lines were switched mid-study to reduce line- selection bias

  6. Healthy checkout display Standard checkout display

  7. In-store materials were developed to help market Shop Healthy’s Checkout Line Pilot

  8. Shop Healthy NYC Healthy Checkout Line Pilot

  9. Healthy Checkout 2015: Study Design/Methods, cont’d • Data collection was conducted during busiest store hours, as identified by management: • 3 to 6 PM Tuesday - Friday, 12 to 3 PM on weekends • Two data collectors were positioned inside the store where they could observe consumer behavior at checkout lines • Data collectors recorded items purchased from observed lines during 18 observation periods

  10. Healthy Checkout 2015: Results • A total of 2,131 shopping parties paid at the study lines during the study period: – 1,218 at the healthy checkout – 913 at the standard checkout • Only 4.0% of these parties (n = 85) bought anything from the checkout area of any line in the store – 3.8% of healthy checkout customers – 4.3% of standard customers

  11. Healthy Checkout 2015: Results • Of customers who bought something from checkout, more than twice the proportion of customers using the healthy checkout bought healthy items as those using the standard checkout (56.5% vs 20.5%; P < .001) • In contrast, relatively fewer customers using the healthy checkout bought unhealthy items compared with those using the standard line (45.7% vs 74.4%; P = .008)

  12. Healthy Checkout 2015: Results • For every 100 customers going through each line: – 4.7 items purchased from healthy totaling $8.73 – 6.4 items purchased from standard totaling $10.16 • Healthy items were purchased at a higher rate from the healthy line vs. the standard line

  13. Healthy Checkout 2015: Results Most common purchases: Healthy: • fresh and packaged fruit (41%; n = 17) • chewing gum (27%; n = 11) • nuts and trail mix (24%; n = 10) Unhealthy: • candy (46%; n = 31) • Kool-Aid packets (18%; n = 12) • Slim Jim meat sticks (15%; n = 10)

  14. Healthy Checkout 2015: Strengths • Observation allowed for understanding of unexpected consumer behavior/shopping patterns: – Moving items without purchase – Purchasing items at different lines from which they were taken – Deliberate/non-impulse buys • Ability to garner store owner support/buy-in through relationships and incentives

  15. Healthy Checkout 2015: Limitations • Observational data is not the ideal methodology; future studies could benefit from technology such as coded UPCs or store-provided cash register sales data • Checkout lines at supermarkets in NYC, and more specifically the Bronx, are not necessarily typical/representative of supermarkets in other locales – Findings not generalizable; methods may need substantial adaptation • Approach may not apply in other settings with checkout items, such as office supply stores, clothing retail stores, etc.

  16. Healthy Checkout 2015: Conclusions • A small percentage of customers (~4%) bought items from checkout area • Not necessarily generalizable to other locations or retail types • More robust studies on larger scale are warranted

  17. Healthy Checkout 2015: Public Health Implications • The long-term sustainability of this type of intervention faces challenges. – Who is responsible for stocking checkouts? 1) Stores 2) Snack Vendors • Stores we worked with were all independently owned; it is unknown how implementation of such an intervention would fare at a corporate-owned chain

  18. Thanks! Tamar Adjoian tadjoian@health.nyc.gov

Download Presentation
Download Policy: The content available on the website is offered to you 'AS IS' for your personal information and use only. It cannot be commercialized, licensed, or distributed on other websites without prior consent from the author. To download a presentation, simply click this link. If you encounter any difficulties during the download process, it's possible that the publisher has removed the file from their server.

Recommend


More recommend