SLIDE 13 Daily Averages
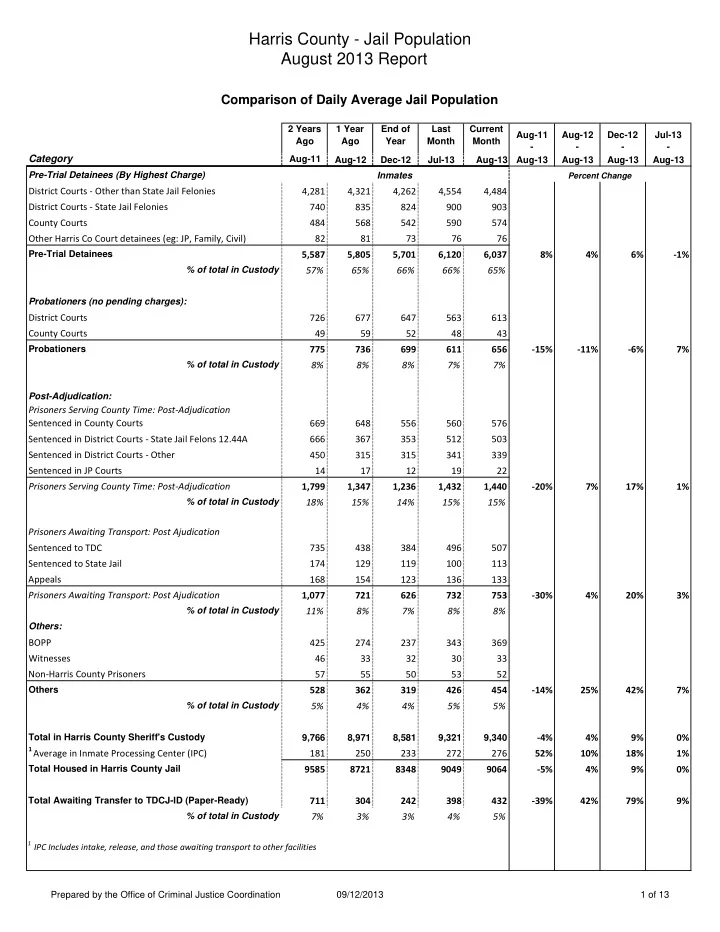
Aug‐12 Aug‐13 Date Jan-11 Feb-11 Mar-11 Apr-11 May-11 Jun-11 Jul-11 Aug-11 Sep-11 Oct-11 Nov-11 Dec-11 Jan-12 Feb-12 Mar-12 Apr-12 May-12 Jun-12 Jul-12 Aug-12 Sep-12 Oct-12 Nov-12 Dec-12 Jan-13 Feb-13 Mar-13 Apr-13 May-13 Jun-13 Jul-13 Aug-13 % # Pre-Trial Detainees (By Highest Charge) District Courts ‐ Other than State Jail Felonies 4,886 4,708 4,583 4,558 4,492 4,439 4,393 4,281 4,285 4,261 4,226 4,244 4,392 4,347 4,238 4,304 4,364 4,365 4,359 4,321 4,340 4,257 4,259 4,262 4,481 4,517 4,363 4,341 4,382 4,474 4,554 4,484 163 District Courts ‐ State Jail Felonies 740 693 681 721 702 720 708 740 720 724 748 725 782 800 787 798 828 865 820 835 858 842 845 824 818 831 859 889 929 911 900 903 68 County Courts 553 509 547 548 568 532 554 484 505 500 494 475 513 483 484 559 543 573 575 568 582 551 523 542 577 537 520 544 595 556 590 574 6 Other Harris Co Court detainees (eg: JP, Family, Civil) 92 85 84 85 86 95 80 82 92 81 81 76 70 81 80 74 56 63 63 81 84 89 80 73 76 87 96 83 83 79 76 76 ‐5 Pre-Trial Detainees 6,271 5,995 5,895 5,912 5,848 5,786 5,735 5,586 5,602 5,566 5,549 5,520 5,757 5,711 5,589 5,735 5,791 5,866 5,817 5,805 5,864 5,739 5,707 5,701 5,952 5,972 5,838 5,857 5,989 6,020 6,120 6,037 5% 232 % of total in Custody 62% 61% 60% 60% 59% 58% 58% 57% 58% 59% 61% 63% 65% 64% 63% 65% 64% 65% 65% 65% 65% 65% 66% 66% 68% 66% 66% 66% 66% 65% 66% 65% Probationers (no pending charges): District Courts 601 588 595 608 639 677 694 726 732 701 687 660 640 656 659 649 655 673 664 677 659 630 635 647 612 611 582 590 548 569 563 613 ‐64 County Courts 41 51 57 52 56 51 56 49 41 43 49 47 44 45 51 56 53 53 56 59 56 58 59 52 47 46 45 41 43 50 48 43 ‐16 Probationers 642 639 652 660 695 728 750 775 773 744 736 707 684 701 710 705 708 726 720 736 715 688 694 699 659 657 627 631 591 619 611 656 ‐17% ‐80 % of total in Custody 6% 6% 7% 7% 7% 7% 8% 8% 8% 8% 8% 8% 8% 8% 8% 8% 8% 8% 8% 8% 8% 8% 8% 8% 8% 7% 7% 7% 6% 7% 7% 7% Post-Adjudication: Prisoners Serving County Time: Post‐Adjudication Sentenced in County Courts 598 563 679 720
723 703
684 669 654 645 590 537 548 582 578 598 627 616 603 648 634 623 606 556 560 597 551 523 574 602 560 576 ‐72 Sentenced in District Courts ‐ State Jail Felons 12.44A 615 640 659 653 661 653 648 666 651 600 460 376 320 324 337 361 380 365 342 367 378 385 371 353 349 392 436 501 558 577 512 503 136 Sentenced in District Courts ‐ Other 458 486 442 428 430 452 415 450 457 425 390 351 317 314 319 316 327 347 329 315 306 343 338 315 295 302 319 325 313 329 341 339 24 Sentenced in JP Courts 21 20 19 16 16 15 12 14 13 13 13 11 13 15 16 14 15 15 15 17 17 15 13 12 17 18 19 16 20 18 19 22 5 Prisoners Serving County Time: Post‐Adjudication 1,692 1,709 1,799 1,817 1,830 1,823 1,759 1,799 1,775 1,683 1,453 1,275 1,198 1,235 1,250 1,289 1,349 1,343 1,289 1,347 1,335 1,366 1,328 1,236 1,221 1,309 1,325 1,365 1,465 1,526 1,432 1,440 6% 93 % of total in Custody 17% 17% 18% 18% 18% 18% 18% 18% 18% 18% 16% 14% 14% 14% 14% 15% 15% 15% 14% 15% 15% 15% 15% 14% 14% 15% 15% 15% 16% 16% 15% 15% Prisoners Awaiting Transport: Post Ajudication Sentenced to TDC 749 710 660 747 787 784 756 735 654 640 672 631 494 549 534 435 462 447 439 438 435 418 379 384 370 409 410 408 440 469 496 507 69 Sentenced to State Jail 140 124 131 130 141 147 168 174 155 154 159 124 130 141 127 134 122 145 143 129 132 136 121 119 128 134 140 143 134 121 100 113 ‐16 Appeals 162 152 159 155 175 167 167 168 165 166 176 173 155 160 168 169 168 158 158 154 149 136 121 123 118 123 132 134 144 142 136 133 ‐21 Prisoners Awaiting Transport: Post Ajudication 1,051 986 950 1,032 1,103 1,098 1,091 1,077 974 960 1,007 928 779 850 829 738 752 750 740 721 716 690 621 626 616 666 682 685 718 732 732 753 2% 32 % of total in Custody 10% 10% 10% 10% 11% 11% 11% 11% 10% 10% 11% 11% 9% 10% 9% 8% 8% 8% 8% 8% 8% 8% 7% 7% 7% 7% 8% 8% 8% 8% 8% 8% Others: BOPP 386 397 386 377 363 386 424 425 440 383 324 309 332 348 338 328 330 318 281 274 261 241 249 237 258 281 275 277 291 295 343 369 95 Witnesses 39 46 53 46 51 43 46 46 56 53 46 37 39 40 39 33 34 34 33 33 38 34 33 32 28 36 30 25 29 27 30 33 Non‐Harris County Prisoners 52 59 53 71 59 46 50 57 56 54 42 48 50 53 48 52 51 56 46 55 53 63 50 50 41 62 48 55 54 60 53 52 ‐3 Others 477 502 492 494 473 475 520 528 552 490 412 394 421 441 425 413 415 408 360 362 352 338 332 319 327 379 353 357 374 382 426 454 18% 92 % of total in Custody 5% 5% 5% 5% 5% 5% 5% 5% 6% 5% 4% 4% 5% 5% 5% 5% 5% 4% 4% 4% 4% 4% 4% 4% 4% 4% 4% 4% 4% 4% 5% 5% 13% Total in Harris County Sheriff's Custody 10,133 9,831 9,788 9,914 9,949 9,910 9,855 9,757 9,667 9,440 9,157 8,824 8,839 8,938 8,803 8,880 9,015 9,093 8,926 8,971 8,982 8,821 8,682 8,581 8,775 8,983 8,825 8,895 9,137 9,279 9,321 9,340 4% 369
1 Average in Inmate Processing Center (IPC)
247 248 266 255 223 200 175 181 191 177 168 156 186 191 202 219 263 245 249 250 269 268 248 233 256 303 288 277 291 280 272 276 9% 26 Total Housed in Harris County Jail 9886 9583 9522 9659 9726 9710 9680 9576 9476 9263 8989 8668 8653 8747 8601 8661 8752 8848 8677 8721 8713 8553 8434 8348 8519 8680 8537 8618 8846 8999 9049 9064 4% 343 Harris County Jail Capacity 9434 9434 9434 9434 9434 9434 9434 9434 9434 9434 9434 9434 9434 9434 9434 9434 9434 9434 9434 9434 9434 9434 9434 9434 9434 9434 9434 9434 9434 9434 9434 9434 Total Awaiting Transfer to TDCJ-ID (Paper-Ready) 695 696 648 748 763 734 708 711 730 646 692 634 473 513 442 283 322 289 287 304 317 318 285 242 265 295 297 291 297 328 398 432 31% 128 % of total in Cvstody 7% 7% 7% 8% 8% 7% 7% 7% 8% 7% 8% 7% 5% 6% 5% 3% 4% 3% 3% 3% 4% 4% 3% 3% 3% 3% 3% 3% 3% 4% 4% 5%
1 IPC Includes intake, release, and those awaiting transport to other facilities
Total per "old" Jail Population Methodology 10,127 9,837 9,795 9,918 9,909 9,869 9,781 9,700 9,614 9,397 9,137 8,822 8,795 8,899 8,767 8,886 9,061 9,133 8,969 8,984 9,011 8,857 8,717 8,615 8,782 9,018 8,862 8,907 9,133 9,302 9,353 9,362
Prepared by the Office of Criminal Justice Coordination 09/12/2013 13 of 13