Introduction: Toads are in decline Humans have a massive impact - - PowerPoint PPT Presentation

introduction
SMART_READER_LITE
LIVE PREVIEW

Introduction: Toads are in decline Humans have a massive impact - - PowerPoint PPT Presentation

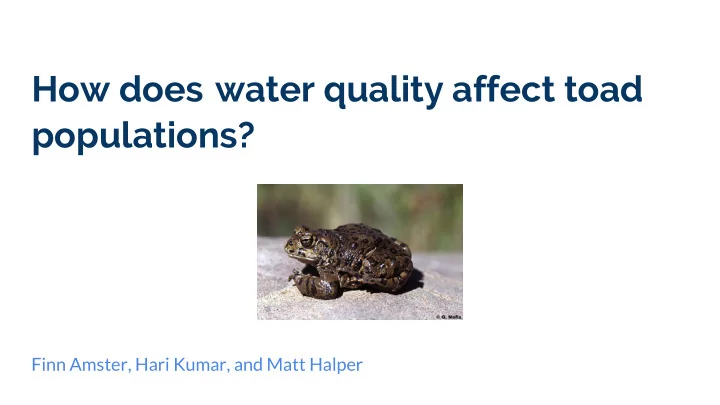
How does water quality affect toad populations? Finn Amster, Hari Kumar, and Matt Halper Introduction: Toads are in decline Humans have a massive impact on toad habitats Both terrestrial and aquatic California toad ( Anaxyrus


slide-1
SLIDE 1

How does water quality affect toad populations?

Finn Amster, Hari Kumar, and Matt Halper

slide-2
SLIDE 2

Introduction:

  • Toads are in decline
  • Humans have a massive impact on toad habitats

○ Both terrestrial and aquatic

  • California toad (Anaxyrus boreas halophilus):

○ Lay eggs at high elevations ○ Need open water for breeding ○ Stripe down the middle of the back

slide-3
SLIDE 3

Hypotheses:

Toad populations will be higher if

  • The temperature is higher
  • Nutrient concentration is high
  • pH is neutral
slide-4
SLIDE 4

Procedure:

  • Pick 4 test sites
  • Test water quality
  • Measure area and depth of body of water
  • Catch toads over 15 minutes
  • Count, measure, and release
slide-5
SLIDE 5

Research Site 1:

  • Eutrophic
  • Low alkalinity
  • Soft

Site 1

slide-6
SLIDE 6

Research Site 2:

  • Eutrophic
  • Low alkalinity
  • Soft

Site 2

slide-7
SLIDE 7

Research Site 3:

  • Oligotrophic
  • Low alkalinity
  • Very soft

Site 3

slide-8
SLIDE 8

Research Site 4:

  • Oligotrophic
  • Low alkalinity
  • Very soft

Site 4

slide-9
SLIDE 9

Research Sites:

Site 3 and 4 Site 3 and 4 Site 2 Site 1 Site 1 and 2

slide-10
SLIDE 10

Site 1 Site 3 Site 2

Number of Toads Site Number

slide-11
SLIDE 11

Toad size and population by site:

  • T-test, size: site 1 and 2 p = 0.0886

Site Number of toads and Toad Size

*

slide-12
SLIDE 12

Total Dissolved Solids (ppm) Number of toads

TDS:

  • Positive correlation
slide-13
SLIDE 13

pH:

pH

  • Strong positive correlation
  • Unexpected but probably due to natural geographical water pH
  • Water tends to be around 8

Number of toads

slide-14
SLIDE 14

Hardness:

  • Strong positive correlation

Hardness (ppm) Number of toads

slide-15
SLIDE 15

Number of toads Size of pond (cubic meters)

Size of pond:

  • Positive correlation
  • Number of toads per cubic meter are somewhat proportional
slide-16
SLIDE 16

Discussion:

Main trends

  • pH
  • Pool size
  • Hardness
  • TDS
slide-17
SLIDE 17

Hypotheses: Revisited

Toad populations will be higher if

  • The temperature is higher
  • Nutrient concentration is high
  • pH is neutral
slide-18
SLIDE 18

How do Humans Relate to Toads and their Survival?

  • Human waste greatly affects water sources

○ Runoff from sewage, fertilizers, industrial manufacturing, etc.

  • Small changes in ponds have big impact on toad

populations

slide-19
SLIDE 19

Going Forward:

Improvements and Sources of Error:

  • More data points
  • Test temperature throughout the day

Further Questions:

  • Cause of elevated pH in Tahoe
  • Specific human activity impacting toads
slide-20
SLIDE 20

Questions?

slide-21
SLIDE 21

Water Temp (°C): 9.7 12.8 16 14.5 Air Temp (°C): 24.2 24.2 24.2 24.2 pH: 8.4 8 7.7 7.6 TDS (ppm): 182 183 29 30 Turbidity (cm): 122 122 122 72 Nitrite (ppm): 0.5 0.5 Size of Pond (m3): 123.5 19.8 15.8 1.6 Alkalinity (ppm): 1.5 2 7 4.8 Hardness (ppm): 100 50 Depth (m): 65.2 17.6 39.3 16.5 Number of Toads: 17 7 1

  • Avg. Size (cm):

2.1 1.8 11.5 Site 1 Site 2 Site 3 Site 4