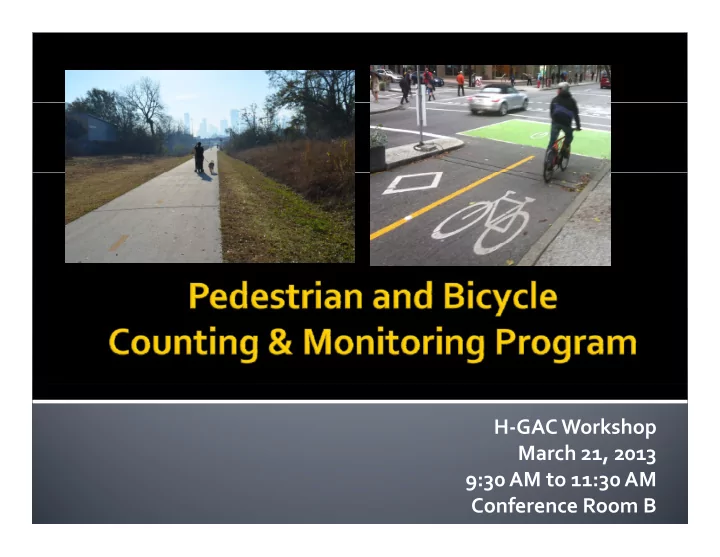
SLIDE 1
H‐GAC Workshop March 21 2013 March 21, 2013 9:30 AM to 11:30 AM Conference Room B
SLIDE 2
f f
A plan for phased implementation of a
system of regular pedestrian and bicycle i d i i i i h counting and monitoring sites in the 8‐ county H‐GAC Transportation Management Area d ll i
Long‐term data‐collection program
SLIDE 3 We need data to determine facility type and locations
We need data to determine facility type and locations
(what’s being used, where it’s being used, etc.)
We do not currently have a regional comprehensive
We do not currently have a regional comprehensive database of walking and biking data counts.
Institutionalize collecting data that will give H‐GAC and
g g local governments adequate data to:
- Understand usage of ped/bike facilities in a variety of regional
contexts;
- Adjust calculations on estimated air quality benefits of
pedestrian and bicyclist facilities based on data collected in the region on facility usage; and
- Estimate demand or usage of planned or proposed pedestrian
- Estimate demand or usage of planned or proposed pedestrian
and bicyclist facilities for project evaluation and selection purposes.
SLIDE 4 Pedestrian Counters
- H‐GAC has three temporary “TRAFx” Infrared Trail
counters
Bicyclist Counters
- Pneumatic tube traffic counters that cities or
consultants already have/use, can be set‐up to use to collect bicyclist counts to collect bicyclist counts
Use them individually or in tandem
SLIDE 5 R d ti ll ti
Recommend routine collection:
- At least once a year if not twice a year
- Could do every other year depending on resources
- Could do every other year depending on resources
24/7 counts for at least one week at a time
3
Recommend collecting in the same locations
- This helps to show trends, impacts of a new
d l d development or project, and consistency.
Detailed considerations on when/where will be
Detailed considerations on when/where will be discussed later.
SLIDE 6 i i i di i
Cities, counties, management districts, MUDs
- Public Works Department
- Traffic Operations Departments
- Planning Department
Consultants can assist as long as the
i / / i i i city/county/entity is in agreement
SLIDE 7
Data will be collected and placed into a
regional database
Data from both pedestrian and bicycle
ill b h d d ibl counters will be shared and accessible between local entity and H‐GAC
Data can be requested from H‐GAC
SLIDE 8
f
H‐GAC has 3 TRAFx Infrared Trail Counters
available to borrow
Handout
SLIDE 9 Coordinate with H‐GAC
- must sign up on the calendar
Interlocal agreement
g
H‐GAC gets the counters ready for city to use
Cit i ibl f i ki t f H GAC
City is responsible for picking up counters from H‐GAC City is responsible for physical deployment/installation
and take down of counters and take‐down of counters
City brings back counters to H‐GAC, then H‐GAC
downloads data and sends back to city downloads data and sends back to city
SLIDE 10 When ‐ Considerations
- A normal/typical week – 24/7 continuous counts
- Usually not on/near a holiday, spring break, major
event, etc.
- Spring/Fall preferable
- Consider the weather
- Once or twice a year is preferable
Handout
SLIDE 11 Where ‐ Considerations
Where Considerations
- At a location where you want to understand
pedestrian activity
- Along a straightaway
- Along a straightaway
▪ Not at an intersection (people standing can skew results)
- Need a static background for infrared, and face away
f d ff from roadway traffic
- Stray away from potential of congregating people
▪ Example: do not point the counter at/near a school or church p p / entrance
- No direct sunlight
- Not directed at moving vegetation (it can heat and be
Not directed at moving vegetation (it can heat and be picked up by infrared)
SLIDE 12 Engage appropriate departments:
- Public Works
- Planning
- Traffic Operations
- Legal (Interlocal Agreement)
- Council (if needed for the Interlocal Agreement)
g
- Police Department (heads‐up about the locations)
- Consultant (if needed)
( )
Handouts (2)
SLIDE 13 Execute Interlocal Agreement
- Work with legal
- Work with H‐GAC
- Get approval by council if needed
- Cannot receive counters without
agreement
Handout
SLIDE 14 Determine count locations
- This can be determined in‐office and/or in the
field to check out potential locations.
- NOTE: Remember the considerations of when and
h l h where to place the counters.
Installation Options:
SLIDE 15 Field Data Inventory Sheet
- H‐GAC sends this to you electronically
- Begin filling this information out electronically,
then print when it is ready to be used in the field f i ll i fill hil i h fi ld for installation to fill out while in the field.
Handout
SLIDE 16
Create sticker to place on counters with
contact info
SLIDE 17 f
Pick up equipment from H‐GAC
- According to the calendar/dates requested
- Reference equipment checklist to ensure all
equipment has been gathered
Handout
SLIDE 18 Gather necessary equipment for installation
Gather necessary equipment for installation:
- Safety gear
- Clipboard, pencil, inventory sheet, map
- Installation guide
- Drill with 5/16th nut driver or slotted screw size
- Measuring wheel (to determine ROW widths for inventory
Measuring wheel (to determine ROW widths for inventory checklist)
- Counter equipment (urban box with counter and infrared,
G3 Dock, metal bands, padlock) G3 Dock, metal bands, padlock)
- GPS or way to record latitude/longitude
- Business card(s)
- Camera
- Camera
Handout
SLIDE 19 As noted, you can determine the location(s)
in the field prior to the installation day or you d l h d can determine exact post/location on the day
Handout
SLIDE 20
“Launch” counter using G3 Dock in “Shuttle Mode”
g 3
G3 Dock
Remove doc by Remove doc by pulling straight out (do not bend). Wait for red light to bli k i kl th Take G3 Dock and Watch for red light to Green “Finished”
Counter
blink quickly on the counter. attach it to the counter. f g show “downloading”. Wait for it to stop. light will show when it is ready.
SLIDE 21
Prepare the metal band and box for installation
p
Choose diameter of metal Weave metal band through slits in metal box th t h ld th t f band appropriate for where counter will be secured (post, tree, etc). that hold the counter. Wrap metal band attached to metal box around the post (tree, or whatever). Close the NOTE: It may be good to place your business card whatever). Close the metal box before securing band. p y inside the metal box.
SLIDE 22 Secure metal band around post (tree, etc.) using a
p ( , ) g drill or screw driver
Make sure infrared scope i i t d i th i ht is pointed in the right direction and put counter at about waist height. Using a drill, secure the There may be long ends sticking out. Make sure to tuck the long ends of the metal band behind the box or through g , metal band with the counter box around the post.
secure them.
SLIDE 23
Lock and secure the counter.
Installed counter without a lock. Installed counter secured using padlock provided If needed, depending on location, provide extra g p p with equipment. , p security to counter.
SLIDE 24
Record all information on the Field Data
Inventory Sheet
Fill out Field Inventory Sheet Measure widths of road, buffer, sidewalk, etc. for field inventory sheet. Note any transit or multimodal connections. f y
SLIDE 25
Take Photos of Surrounding Area (context)
g ( )
SLIDE 26 Record Exact Time after Installation
CRITICAL: Be sure to write down an exact time after you have installed counter and f y filled out inventory sheet. This marks exact time when we should
- bserve data collected by the counter
- bserve data collected by the counter.
SLIDE 27
Repeat all of these steps for each of the counters
p p that will be installed.
When you get back to your office, record all Field
Data Inventory information in the electronic version as to not lose any of the data collected version, as to not lose any of the data collected.
SLIDE 28 Do not take co nters do n prior to one eek
Do not take counters down prior to one‐week
Record on the Field Data Inventory Sheet an
exact time prior to removal of the counters.
Return counters and digital Field Data
Inventory Sheet to H‐GAC ASAP
H‐GAC will process the data within two weeks
and get back with you g y
Handout
SLIDE 29
Once you return counter equipment to H‐
GAC, we will upload the data from the d b d d counters, save to our database, and send you back the summary tables including raw data. l Example
SLIDE 30
Chelsea Young, AICP Pedestrian‐Bicyclist Coordinator l l Houston‐Galveston Area Council chelsea.young@h‐gac.com 713‐993‐2497 h www.h‐gac.com
SLIDE 31
Robert Benz And Jonathan Tydlacka Jonathan Tydlacka Texas Transportation Institute
SLIDE 32 Co nter Settings
Counter Settings
- Sensitivity – Air switch setting
- Dead time ‐Time between allowable tube strikes
M /Mi S d M d Mi hi l d ll d
- Max/Min Speed – Max and Min vehicle speed allowed
- Acceleration – Max allowable acceleration
Field Settings and Procedures
6 ft i
- 6 ft spacing
- Bike Lane Classification
Bike Classification
Case Study
Case Study
Speeds
SLIDE 33
Data driven decisions Justify Investment
l d
No specialized equipment Make bike counts part of the normal count
l h l l cycle with local agencies
SLIDE 34
Two time readings a know distance apart Calculate a speed A to A or B to B
d l l l d b
Knowing speed, axle spacing is calculated by
knowing time to travel from A to B
SLIDE 35
Bikes Lighter than Cars Bike Slower than Cars
h h l
Shorter Wheel Base No Previous Classification Scheme
l d h k l
Do Not Always Ride on the Bike Facility
SLIDE 36
SLIDE 37
Delta III Classifiers NOT NT versions (use 4) Delta III Classifiers NOT NT versions (use 4) Dead time 20ms (10 ms default) Air Switch Sensitivity 15 ms (30 ms default) Air Switch Sensitivity 15 ms (30 ms default) Max Speed 50 mph Min Speed 5 mph Min Speed 5 mph Max Acceleration 5 mph/s 6 Foot Tube Spacing 6 Foot Tube Spacing
SLIDE 38
SLIDE 39
Straight Away Straight Away Mid Block (reduce turns and stops) Need Post to Secure the Counter to Need Post to Secure the Counter to Same Length Tube (w/in 2”) 25’ on Bike Lane Six Foot Spacing Six Foot Spacing Tube Stretch 10% (6” on a bike lane 1’ on trail)
SLIDE 40
6 Foot Spacing
SLIDE 41
SLIDE 42
SLIDE 43
f
Typical 10 ‐ 16 ft. (3 ‐ 5 m) Six (6) foot spacing was used
SLIDE 44
f
FHWA‐F2 13 Classification (48 in to 72 in) TTI 24 Wheel Base (24 in to 48 in)
h l
TTI 30 Wheel Base (30 in to 48 in)
SLIDE 45
Bike Type Wheel Base Wheel Size Mountain Bike 42 26 Small Road Bike Orange 41 25 Small Road Bike Orange 41 25 Road Bike 27" 43 27 Kid Mountain 39 24 R d Bik 41 25 Road Bike 41 25 Child Bike 20" 34 20 Child Bike 20" 35 20 Child Bike 12" 20 12 Tandem Cruzer 67 26
SLIDE 46
SLIDE 47
SLIDE 48
f
Closed Course Most of the Day Bikers and Inline Skaters Only
l
1.1 Miles Packs of Bikes
l l d
Closely Spaced Adults
l l
Multiple Tests No Problem with Bikes
d b and Tubes
SLIDE 49
SLIDE 50
SLIDE 51
SLIDE 52 Time Period Manual Count Axle/2 Count Classified TTI - Bikes (24) Classified TTI - Bikes (30) Time Period Manual Count Axle/2 Count Total Vehicles Bicycles Total Vehicles Bicycles 9:00 – 10:00 AM 28 32 28 28 28 28 4:00 – 5:00 PM 204 202 189 187 187 187 5:00 – 5:30 PM 120 116 106 105 106 106 PM total 4:00 – 5:30 PM 324 318 295 292 293 293
SLIDE 53
SLIDE 54
4 Lane Boulevard Bike Lane Width EB/WB 3.4/5.0
ff d h
Traffic Lane Width 11.8/14.9 Speed Limit 35 mph
k
No Parking Residential
Weekday ADT Weekend ADT AM Peak PM Peak ADT ADT Peak Peak
6165 4233 579 524 5980 3873 380 816 5980 3873 380 816
SLIDE 55
SLIDE 56
Many bikers ride on sidewalks FHWA Classification misses bicycles
d h b k
Need to change settings to count bikes Increase sensitivity
d bl b
Speeds seem reasonable but were not
verified d k d ff
Setting do make a difference Wheel Base 30 worked better than 24
SLIDE 57 Collect Inventory Items
- Bike Facility Width
- Roadway Width & Each Lane Width
- Buffer Width
- Parking
- Area type (residential, retail, mixed, industrial)
yp
- (See Data Collection Sheets)……
SLIDE 58
Periodic counts Week long counts to determine weekly
d trends
Same locations
f d l
Mix of commuter and recreational
SLIDE 59
R b B Robert Benz Research Engineer T A&M T i I i Texas A&M Transportation Institute R‐benz@tamu.edu