gulfstream s contributions to the 3 rd aiaa high lift
play

Gulfstreams Contributions to the 3 rd AIAA High Lift Prediction - PowerPoint PPT Presentation

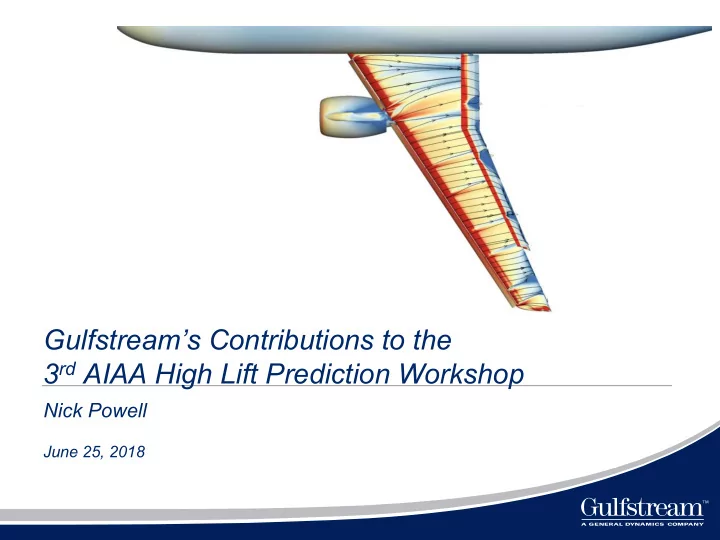
Gulfstreams Contributions to the 3 rd AIAA High Lift Prediction Workshop Nick Powell June 25, 2018 Outline Overview 3 rd High Lift Prediction Workshop Solution Background Grid Background HLCRM Results Grid Convergence


  1. Gulfstream’s Contributions to the 3 rd AIAA High Lift Prediction Workshop Nick Powell June 25, 2018

  2. Outline • Overview – 3 rd High Lift Prediction Workshop – Solution Background – Grid Background • HLCRM Results – Grid Convergence at α = 16˚ – Grid Convergence at CL max – Boundary Layer (BL) Grid Dependency Study – Reynolds Number (RN) Dependency Study • JSM Results – Comparison to Experimental Data • Conclusions 1

  3. 3 rd AIAA High Lift Prediction Workshop • Held at the 2017 AIAA Aviation Conference • 36 Participants from 14 countries • Focused on two geometries – NASA’s High Lift Common Research Model (HLCRM) – JAXA’s Standard Model (JSM) 2

  4. Solution Background • Solver: FUN3D – Developed at NASA Langley – Finite volume RANS solver – Roe’s flux difference splitting – Node-centered, unstructured, mixed-element • Turbulence model: SA • Convergence criteria – CL and CD variation within � 0.1% – JSM grids required relaxed criteria to � 1.0% • Flow initialization – Cases were either submitted from scratch (free-stream initialization) or with restarts (initialized from previously resolved solutions at lower AOA) 3

  5. Custom Grid Background • Custom grids were generated with HeldenMesh – Commercial unstructured grid generator similar to VGRID – Mixed element – Advancing front and advancing layers (BL) grid algorithms – Rapid grid generation through autonomous modeling and Advancing Layers parallel processing Volume Grid • BL grid parameters – Geometric growth rate ≤ 15% Advancing Front – Exponential growth rate of ~2.0% Surface Grid – Targeted a flat-plate y + ≃ 1 – Approximately 30 points in the boundary layer at 50% MAC Advancing Front Volume Grid 4

  6. Outline • Overview – 3 rd High Lift Prediction Workshop – Solution Background – Grid Background • HLCRM Results – Grid Convergence at α = 16˚ – Grid Convergence at CL max – Boundary Layer (BL) Grid Dependency Study – Reynolds Number (RN) Dependency Study • JSM Results – Comparison to Experimental Data • Conclusions 5

  7. NASA’s High Lift Common Research Model • Wing-body representing a modern 300 pax commercial airliner • Full-Scale model – Mean Aerodynamic Chord (MAC): 275.8 in. – Wing-semi-span 1156.75 in. (96.4 ft) – Reference area: 4130 ft 2 • Slats and flaps included but not support brackets 6

  8. HLCRM Cases Grid study at Grid study at Grid study HLCRM α = 8˚ α = 16˚ polar to stall 1a (full gap) yes yes yes 1b (full gap w adaption) no no no 1c (partial seal) no no no 1d (partial seal w adaption) no no no Free-stream Mach Number 0.2 3.26 x 10 6 Reynolds Number (based on MAC) Reference Static Temperature 518.67 ˚R 7

  9. Grid Specifications Series/ Case/ Type Number of Number of Grid Tool ID Config Points (M) Cells (M) Developer Mixed (prism 8, 26, 70, 22, 65, 170, B2 1a dominant) 206 541 Pointwise Pointwise 88, 106, GAC Mixed (prism 30, 33, 41, 132, 174, HLCRM 1a dominant) 55, 78, 131 250, 425 Gulfstream HeldenMesh 8

  10. Provided HLCRM Medium Grid 9

  11. GAC Custom HLCRM Medium Grid 10

  12. GAC Custom HLCRM Medium Grid Increased grid resolution along mid-chord of slat Fuselage has ~40% less triangle faces than provided Medium grid Increased grid resolution along leading edges Increased span-wise resolution of grid on wing TE 11

  13. Grid Convergence at 16˚ AOA CL increases with grid refinement Custom and provided grids exhibit different rates of grid convergence 12

  14. Grid Convergence at 16 ˚ AOA ~0.3% change in CL from GAC Medium grid to GAC XXFine GAC Medium reached same C L as the provided XFine grid with 20% the number of points 13

  15. Grid Convergence by Aircraft Component CL_wing CL_slat Primary lifting surface (wing) exhibits the most grid dependency CL_fuselage CL_flap Custom fuselage sufficiently converged at Medium level even though it has ~40% less triangle faces than provided grid 14

  16. Grid dependency on CL max Custom grid has CL max of provided converges on a grid increases with CL max of 2.5 grid refinement Grid dependency increases with α 15

  17. Exceptions to the 3 rd HLPW Gridding Guidelines • Custom grid set does not grow by increments of 3X between grid levels – Global source terms were scaled by 20% between grid levels • Custom grid set does not grow uniformly in all directions – Advancing-layer initial height and growth rates were kept constant across the grid set 10 -6 N -2/3 10 6 N Solving an XXFine grid for the Provided grid set would be prohibitively Grid Designation Provided Custom Provided Custom expensive XCoarse -- 10.9 -- 27.8 Coarse 24.8 9.7 8.1 33.3 For 50 million more points, custom grid set Medium 11.3 8.4 26.5 41.4 has 2 more grid levels Fine 5.9 7.0 69.9 54.5 XFine 2.9 5.5 205.6 77.9 XXFine -- 3.9 -- 131.1 16

  18. Advancing Layer (Boundary Layer) Grid Dependency Study • Advancing Layer algorithm ∆$ % = ! " 1 + )1 1 + )2 %+" %+" – ! " = initial grid height off of surface – r1 = geometric growth rate – r2 = exponential growth rate Approx. # of Grid Points in BL at Designation δ1 r1 r2 50% MAC Medium 0.00160 0.15 0.02 31 Medium_BL08 0.00128 0.12 0.02 36 Medium_BL06 0.00096 0.09 0.02 43 17

  19. BL Grid Dependency at 3.26 M RN and 20 M RN Small, 0.2% change in CL max at 3.26 million RN BL grid exhibits significant grid dependency at 20 million RN 18

  20. Reynolds Number Study • Polar up to stall – Restarted solutions from previous α after α = 16˚ • Reference temperature and reference chord kept constant • Utilized custom HLCRM medium grid with fine BL – “BL06” to avoid grid dependency at high RN 19

  21. Lift Dependency on Reynolds Number High-lift dependency is non-linear ~5% increase in CL max CL 0 and CL max increase with RN 20

  22. Pitching Moment Dependency on Reynolds Number CM 0 decreases with RN Pitch up is delayed for higher RN 21

  23. Outline • Overview – 3 rd High Lift Prediction Workshop – Solution Background – Grid Background • HLCRM Results – Grid Convergence at α = 16˚ – Grid Convergence at CLmax – Boundary Layer (BL) Grid Dependency Study – Reynolds Number (RN) Dependency Study • JSM Results – Comparison to Experimental Data • Conclusions 22

  24. Case 2: Comparison with Experiment using the JSM • JAXA’s Standard Model – Wing-body representing a modern 100 pax commercial airliner – 17% Scaled Model • Mean Aerodynamic Chord (MAC): 529.2 mm • Wing-semi-span: 2300 mm (~7.4 ft) • Reference area: 1,123,300 mm 2 (~12 ft 2 ) • Comparison to Experimental Data – Data obtained from JAXA’s 6.5m X 5.5m wind tunnel run at 1.93 million RN 23

  25. HLPW Case 2 Polar, specified Polar, with transition JSM Polar transition prediction 2a (no nacelle) yes preliminary no 2b (no nacelle w adaption) no no no 2c (with nacelle) yes no no 2d (with nacelle w adaption) no no no Free-stream Mach Number 0.172 Reynolds Number (based on MAC) 1.93 x 10 6 Reference Static Temperature 551.79 ˚R 24

  26. Grid Specifications Series/ Case Type Number of Number of Developer Tool ID Points (M) Cells (M) C2 2a,2c Mixed (prism 16, 21* 52, 65* S/G** VGRID dominant) GAC 2a,2c Mixed (prism 63 192 Gulfstream HeldenMesh JSM 1 dominant) GAC 2a,2c Mixed (prism 31 85 Gulfstream HeldenMesh JSM 2 dominant) * Without and with nacelle ** Spaceship Company and Gulfstream Aerospace GAC JSM 2 utilized grid parameters from the custom HLCRM Medium, which were adjusted to account for aircraft size, model scale and grid units 25

  27. JSM Results CFD Correlates fairly well with experimental data in the linear region but is inconsistent near stall GAC_JSM_1 GAC_JSM_2 Corrected Test 26

  28. JSM Results near Stall GAC_JSM_1 over predicts CL max but nearly matches α max of the test data GAC_JSM_2 and the provided grid almost match CL max but under predict tunnel α max by 2˚ GAC_JSM_1 GAC_JSM_2 Corrected Test 27

  29. JSM Results near Stall What triggered stall for the provided grid and GAC_JSM_2? GAC_JSM_1 GAC_JSM_2 Corrected Test 28

  30. Flow Visualization Comparisons Skin Friction Coefficient at α = 18.5˚ Red: Positive White: Neutral Blue: Negative Tunnel Oil Flow at 18.58˚ 29

  31. Flow Visualization Comparisons Provided grid and GAC_JSM_1 grids exhibit large separation just aft of the 3 rd most outboard slat bracket 30

  32. Custom JSM Results Compared to Other Participants 31

  33. Conclusions • It is important to analyze high-lift grid dependency up to stall – Grid dependency increased with α – α max can be highly grid dependent (as seen with the JSM) and can account for a substantial loss in CL max • It is import to analyze high lift dependency on Reynolds Number – Test data was gathered at low RN, which is typical due to the cost constraints of obtaining high RN data – RN dependencies were non-linear near stall • Starting grid distribution and size are key to the success of a grid convergence study – With 80% fewer points, the custom medium grid obtained the same result as the provided extra-fine grid – By starting with a finer medium grid, we were able to use smaller increments and solve two more grid levels for a relatively small cost 32

Download Presentation
Download Policy: The content available on the website is offered to you 'AS IS' for your personal information and use only. It cannot be commercialized, licensed, or distributed on other websites without prior consent from the author. To download a presentation, simply click this link. If you encounter any difficulties during the download process, it's possible that the publisher has removed the file from their server.

Recommend


More recommend