
SLIDE 1
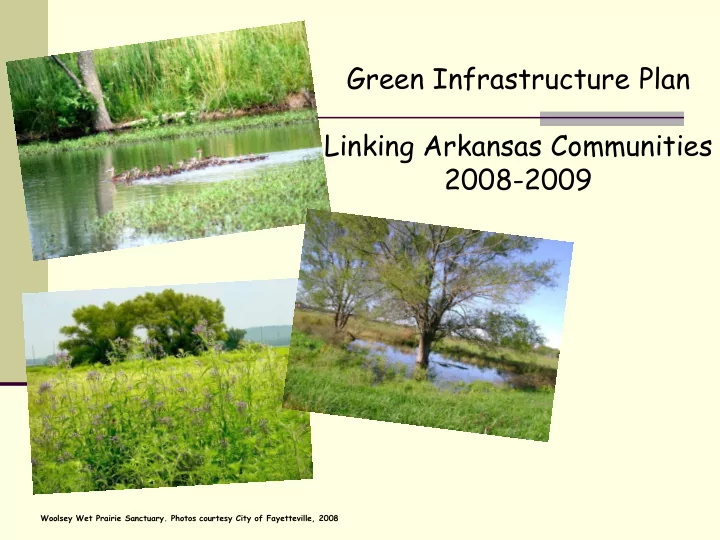
Green Infrastructure Plan Linking Arkansas Communities 2008-2009
Woolsey Wet Prairie Sanctuary. Photos courtesy City of Fayetteville, 2008
Green Infrastructure Plan Linking Arkansas Communities 2008-2009 - - PowerPoint PPT Presentation
Green Infrastructure Plan Linking Arkansas Communities 2008-2009 Woolsey Wet Prairie Sanctuary. Photos courtesy City of Fayetteville, 2008 Topics Summary of the Project What is Green Infrastructure? Reasons to develop this Plan
Woolsey Wet Prairie Sanctuary. Photos courtesy City of Fayetteville, 2008
Summary of the Project What is Green Infrastructure? Reasons to develop this Plan Existing Green Infrastructure
What’s next?
Sublett Creek draining Lake Lucille through The 14 acre Brooks-Hummel property recently acquired by City of Fayetteville with the help
for park land with nature trails. Photo credit Duane Woltjen, March 2008
Convene partners to identify and conserve Open Space Help private landowners conserve Open Space Help communities expand wisely to connect with Open Space Participate in community growth planning to reduce ecological
impacts and fire risk
Example Green Infrastructure Plan from: Maryland’s Green Infrastructure Assessment
http://www.dnr.state.md.us/greenways/gi/gi.html
172 mi2 (445 km2) area encompassing City Limits and Planning Areas of Farmington, Greenland, Johnson, & Fayetteville and the Ozark National Forest, Wedington Wildlife Management Unit with adjacent unincorporated areas of Washington County.
Fayetteville Natural Heritage Association, Barbara Elaine Boland, August 2008
Potential Elements that may constitute our Green Infrastructure Network Existing parks and trails Proposed parks and trails Public and private conserved areas Working lands with environmental value Wetlands and Prairies Riparian zones Historical sites Sensitive Karst recharge areas Highly rated sites from the Urban Forest Conservation Assessment for Fayetteville
Diagram credited to Conservation Resource Alliance, Michigan, in Green Infrastructure – Linking Landscapes and Communities, 2006.
Ensures that both green space and development are placed
Enables conservation and development to be planned in
Enables a region’s communities to create a vision that is
Identifies vital ecological areas and linkages prior to
Identifies opportunities for the restoration and enhancement
From: “Green Infrastructure: Smart Conservation for the 21st Century,” by Mark Benedict and Ed McMahon.
Land Use Land Cover changes Loss of crop land and pasturage Changes in the forests Water issues Growth projections
Walking, hiking, biking, family outings Free-ranging childhood exploration Physical activity, stress reduction, spiritual renewal Reduce obesity, improve mental & physical health
Water quality and abundance
Sensitive Karst groundwater recharge areas Stormwater runoff Example: Increasing forest cover from 27% to 40%
Fayetteville estimated to increase environmental benefit from $92 million to $135 million in stormwater containment (American Forests, 2002)
Loss of open lands & crop and pasture lands
In US 6,000 acres of open space are lost DAILY
Fragmented habitats
Healthy habitats require sufficient area and corridors
that join them
Recent Announcement: Arkansas Game & Fish,
Region 10, new Wildlife Management Area in NW Arkansas formed in part to deal with habitat loss due to sprawl
Agriculture/Grassland Urban/Commercial Forest/Woodland Water Barren 1992 2004 2006
Data source: GeoStor: 1992 National Land Cover Dataset, 2004 Land Use Land Cover, 2006 Land Use Land Cover
1992 2004 2006 6.9% of area 11.4% of area 15.4% of area 1992-2004 4.5%/12 yrs = .4%/yr 2004-2006 4.0%/2 yrs = 2%/yr
1997 2002 2007
Data Source: USDA National Agricultural Statistics Service, Agricultural Census, 2002. 2007 figures expected before year end.
1992
178,375 178,375 acr acres es in in cr crops
and pastur ture 4.3% 4.3% los loss = = -7,752 acr 7,752 acres es 182,578 182,578 acr acres es in in cr crops
and pastur ture 2.3% 2.3% los loss = = -4,203 acr 4,203 acres es 170,623 170,623 acr acres es in in cr crops
and pastur ture Projected
8% los loss =-13,650 acr 13,650 acres es Projected
156,973 acres es in in cr crops
and pastur ture
1985 – 2000 In Fayetteville 18.3% decline in Heavy Canopy (2,525 to 2,130 acres = -395 acres) An indicator of ecological change resulting from urban development 40% increase in Moderate Canopy (240 to 336 acres = 96 acres) 3% increase in Low Canopy (24,550 to 25,207 acres = 657 acres)
Data Source: Urban Ecosystem Analysis Benton & Washington Counties, Arkansas: Calculating the Value of Nature, American Forest, Inc., September, 2002
Data Source: Urban Ecosystem Analysis Benton & Washington Counties, Arkansas: Calculating the Value of Nature, American Forest, Inc., September, 2002
Data Source: Urban Ecosystem Analysis Benton & Washington Counties, Arkansas: Calculating the Value of Nature, American Forest, Inc., September, 2002
Washington Co. Benton Co. Illinois River watershed Beaver Lake Watershed
Rivers & Streams Impaired Streams Drainage Ditches Dams (>25ft high) Watershed boundary Study Area Boundary
Beaver Lake Watershed Illinois River Watershed
M i s s o u r i Washington County
Cities of Greenland, Farmington, Johnson, and Fayetteville
Beaver Lake
Upper Arkansas River Watershed
Washington County Population Statistics
Census 2000 157,715 Estimate 2007 194,292 Projected 2015 221,548
Map Elements
Existing Trails Proposed Trails Parks Heritage Trails Pig-Trail Scenic Byway Major Roads Study Area Boundary Cemeteries Points of Interest
I-540 Hwy 71 Hwy 71 Hwy 265 Hwy 265 Hwy 45 Hwy 16 Pig Trail I-540 Hwy 62 Hwy 16
Ozark National Forest Wedington Wildlife Management Unit
Fayetteville Johnson Farmington Greenland
Public Meeting Greenland Public Meeting Johnson Public Meeting Fayetteville Public Meeting Farmington Public Meeting Fayetteville Public Meeting Fayetteville Public Meeting Fayetteville