
SLIDE 1
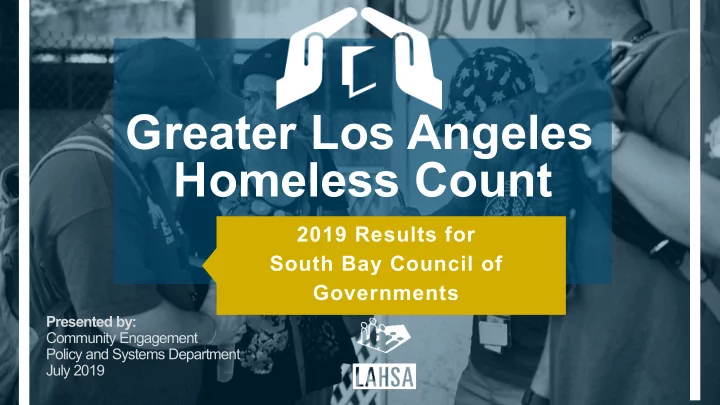
Greater Los Angeles
2019 Results for South Bay Council of Governments
Homeless Count
Presented by: Community Engagement Policy and Systems Department July 2019
Greater Los Angeles Homeless Count 2019 Results for South Bay - - PowerPoint PPT Presentation
Greater Los Angeles Homeless Count 2019 Results for South Bay Council of Governments Presented by: Community Engagement Policy and Systems Department July 2019 2 BEHIND THESE NUMBERS... are our neighbors THAT'S why we count. Thank you
2019 Results for South Bay Council of Governments
Presented by: Community Engagement Policy and Systems Department July 2019
THAT'S why we count.
are our neighbors
Thank you to the thousands
community service providers who make the Homeless Count possible, and who have helped our homeless services system reach more people than ever before.
2
Point-in-Time Count
Shelter Count Street Count Youth Count
Count
methodology
Demographic Consultant
Demographic Count
10 days of January.
demographic survey component.
City of LA CDs, and less at community level
4
The Greater Los Angeles Homeless Count is hybrid count of both a PIT count and sampling.
We collect data on several populations, including but not limited to:
5
6
Sample process for sensitive, personal questions Use Response Card
Partnership with USC
School of Social Work and US Leonard D. Schaeffer Center for Health Policy and Economics.
process, methodology and statistical analysis for the:
Homeless Count partners help us develop, plan, and execute each portion of the count. Some of these include:
(LACEYH)
People experiencing homelessness at point-in- time count
COUNTY OF LOS ANGELES
12% Increase
16% Increase
CITY OF LOS ANGELES
The LA CoC total number was 56,257 a 12% increase from 2018. The LA CoC is Los Angeles County excluding Glendale, Pasadena, & Long Beach CoCs.
*Numbers presented include LA, Glendale, Pasadena, and Long Beach CoCs
Service Planning Area (SPA) 2018 2019 % Change 1- Antelope Valley 3,203 3,293 +3% 2- San Fernando Valley 7,738 8,047 +4% 3- San Gabriel Valley 4,282 5,021 +17% 4- Metro Los Angeles 14,218 16,401 +15% 5- West 4,401 5,223 +19% 6- South 8,343 9,629 +15% 7- East 4,569 5,040 +10% 8- South Bay 6,011 6,282 +5% Totals 52,765 58,936 +12%
SPA 2 includes Glendale, SPA 3 includes Pasadena, and SPA 8 includes Long Beach
10
Veterans decreased by 28% Chronically Homeless increased by 44% Seniors 62 and over increased by 24% Heath and Disability Substance Abuses Disorder decreased by 7% Serious Mental Illness increased by 11% Developmental Disability increased by 293% Physical Disability increased by 52% Domestic Violence (DV)/ Intimate Partner Violence (IPV) DV/IPV Experience increased by 158% Fleeing DV/IPV increased by 1%
Note: Responses not mutually exclusive
release
provide feedback
the feedback period; however, if no large issues identified, potentially right after
many of our city partners
13
State & Local Community
Increase Affordable Housing Limit Rental Increases Prevent Unjust Evictions
14
1. Support more interim and supportive housing in your local community; Join the Everyone In Campaign at https://everyoneinla.org 2. Advocate for expanded state and federal funding for affordable housing and homeless services at https://www.lahsa.org/policy/legislative-affairs 3. Volunteer at your local homeless service agency at https://www.lahsa.org/get-involved 4. Volunteer for the 2020 Street Count on January 21, 22, and 23 at https://www.theycountwillyou.org/
15
16
Community Engagement Coordinator for SPA 1, tkirkconnell@lahsa.org (213) 213-225-8413 work
Community Engagement Coordinator for SPA 2, scaruana@lahsa.org (213) 225-8477 work
Community Engagement Coordinator for SPA 3, dalcedo@lahsa.org (213) 225-8462 work
Community Engagement Coordinator for SPA 4, plozano@lahsa.org (213) 797-4566 work
Community Engagement Coordinator for SPA 5, rlopez@lahsa.org (213) 797-4572 work
Community Engagement Coordinator for SPA 6, bdaniel@lahsa.org (213) 225-8408 work
Community Engagement Coordinator for SPA 7, jjimenez@lahsa.org (213) 797-4641 work
Community Engagement Coordinator for SPA 8, scooper@lahsa.org (213) 797-4634 work
Supervisor, Community Engagement syu@lahsa.org, (213) 233-4733
Engagement, sdesantiago@lahsa.org (213) 222-4748 work
Engagement, cverjan@lahsa.org, (213) 683-3338 work