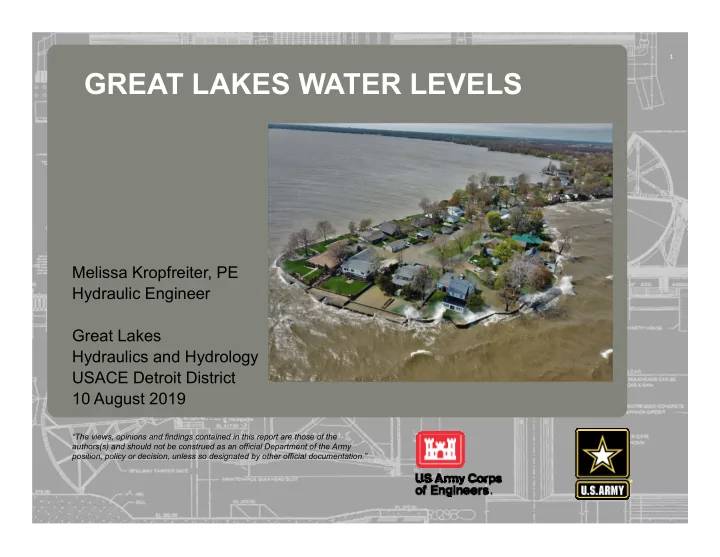

1 GREAT LAKES WATER LEVELS 237 217 200 80 252 237 217 200 119 174 237 217 200 27 .59 255 0 163 131 239 110 112 62 102 130 255 0 163 132 65 135 92 102 56 120 255 0 163 122 53 120 56 130 48 111 Melissa Kropfreiter, PE Hydraulic Engineer Great Lakes Hydraulics and Hydrology USACE Detroit District 10 August 2019 “The views, opinions and findings contained in this report are those of the authors(s) and should not be construed as an official Department of the Army position, policy or decision, unless so designated by other official documentation.”
Hudson Bay Albany Ogo Alb any 2 MONITORING GREAT LAKES e r ki R i v R iver Diversion Dam Riv e Ogoki Project r B a Control Dam s in WATER LEVELS Lake ami Ri v e r nog Nipigon Ke Diversion Dam Long Lake Nipigon River Long Lake Project Control Dam Aguasabon River Thunder Bay Ontario Minnesota S u p e e r k i o a r L Duluth Keweenaw Canada Peninsula United States Quebec M i s s i s s i p p Sault Ste. Marie The Great Lakes Basin i R i v e r B a Lake Superior Control Structure s i n St. Marys River Sault Ste. Marie O t t a w a • 14,000 miles of shoreline River Straits Of Mackinac Green Bay L a Georgian Bay • 95,000 square miles of water k e Montreal Ottawa Green Bay LAKE ST. LOUIS Cornwall n H St. Lawrence River • 200,000 square miles of land a u Control structure Massena g Wisconsin r i Michigan h o St. Lawrence River c n Kingston • 8 States & 2 Provinces i M Cape Vincent Bay City Milwaukee Toronto Lake e New York k Ontario La Oswego Niagara Falls St. Clair River Rochester Welland Canal Niagara River Lake St. Clair Buffalo Detroit Chicago Lake Detroit River Erie Chicago Sanitary & Ship Canal Toledo G r Illinois e a t n i Pennsylvania Cleveland as Ohio PENNSYLVANIA Illinois Waterway B Indiana L a k g e es a n i 100 years of coordinated water level data Forecasting since the 1950s
3 MONITORING GREAT LAKES WATER LEVELS Daily Average Water Levels Based on Lake-Wide Average Network • Lake Superior: Duluth, Marquette, Pt. Iroquois, Thunder Bay, Michipicoten • Lakes Michigan-Huron: Harbor Beach, Ludington, Mackinaw City, Milwaukee, Tobermory, Thessalon • Lake St. Clair: St. Clair Shores, Belle River • Lake Erie: Toledo, Cleveland, Port Stanley, Port Colborne • Lake Ontario: Oswego, Rochester, Toronto, Kingston, Port Weller, Cobourg
GREAT LAKES WATER LEVELS 4 Record Rise (1918-2019) > 1 decade low water Record lows Record highs
5
6 2012 VS. 2019 ON THE ST. CLAIR RIVER
HIGH WATER LEVEL IMPACTS 7 • Shoreline erosion • Less beach • Property damage • Greater impact from seiche (wind) events • Ice jams produce greater chance for flooding Seiche Wind Storm Water Level Wind Set-up Undisturbed Water Level Lake profile showing wind set-up
8 HIGH WATER PHOTOS Courtesy of USCG and the Port of Monroe, MI
9 ANNUAL WATER LEVELS AND THE HYDROLOGIC CYCLE FALL WINTER SPRING SUMMER Increased Snow melt, Snow Increased sunshine rainfall, accumulation evaporation warms increased lake water runoff Typical Lake Michigan-Huron Water Level
10 FACTORS IMPACTING WATER LEVELS Net Total Supply Net Basin Precipitation Evaporation Supply Runoff Inflow from Upstream Lake Outflow
11 WHAT HAPPENED IN THE LAST YEAR? 0.7 ft rise August 2018 – August 2019 • Wet Fall • Snowy winter • Good ice cover • Wet spring • High NBS Beginning of August 2018 Level: 602.55 ft 0.7 ft rise Beginning of August 2019 Level: 603.27 ft
12 FACTORS IMPACTING WATER LEVELS AUGUST 2018 – AUGUST 2019 LAKE SUPERIOR Net Total Supply 4.0 ft Net Basin 3.8 ft Precipitation Evaporation Supply Runoff 0.2 ft Inflow from 3.3 ft* Upstream Outflow NTS – Outflow = Change in lake level (Inflow + NBS) – Outflow = Change in lake level 3.3 = 0.7 ft (0.2 + 3.8) – *Pre-Project (unregulated, natural) St. Marys River flows would have been the equivalent of 3.5 ft on Lake Superior
13 SIX MONTH WATER LEVEL FORECAST New record highs set in May, June, and July Projected levels (dashed green line): • Expected to be at historic record high in August Forecasted range (shaded red area): • 9 to 13 inches above long term average levels • Above last year through October
14 WHAT HAPPENED IN THE LAST YEAR? 1.3 ft rise from August 2018 – August 2019 • Snowy winter • Good ice cover • Wet spring • High NBS Beginning of August 2018 Level: 580.57 ft 1.3 ft rise Beginning of August 2019 Level: 581.88 ft
15 FACTORS IMPACTING WATER LEVELS AUGUST 2018 – AUGUST 2019 LAKE MICHIGAN-HURON Net Total Supply 6.9 ft Net Basin 4.6 ft Precipitation Evaporation Supply 2.3 ft* Runoff Inflow from Upstream 5.6 ft Lake Outflow NTS – Outflow = Change in lake level (Inflow + NBS) – Outflow = Change in lake level 5.6 = 1.3 ft (2.3 + 4.6) – *Pre-Project (unregulated, natural) St. Marys River flows would have added 2.4 ft to Lake Michigan-Huron
16 SIX MONTH WATER LEVEL FORECAST Within 1 inch of record high in June and July Projected levels (dashed green line): • Begin seasonal decline in August Forecasted range (shaded red area): • 28 to 31 inches above long term average levels • 7 to 15 inches above last year’s levels
17
18 LATEST WATER LEVEL INFORMATION https://www.lre.usace.army.mil/Missions/Gre at-Lakes-Information/Great-Lakes- Information.aspx
19 LIVING ON THE COAST https://www.lre.usace.army.mil/Portals/69/docs/GreatLakesInfo/docs/CoastalPro gram/Living%20on%20the%20Coast%20Booklet.pdf?ver=2016-06-06-105107- 683
20 QUESTIONS? Melissa Kropfreiter (313) 226-6443 Melissa.A.Kropfreiter@usace.army.mil
Recommend
More recommend