
SLIDE 1
GIS for Noise Simple GIS Tools to Improve Noise Analysis Presented - - PowerPoint PPT Presentation
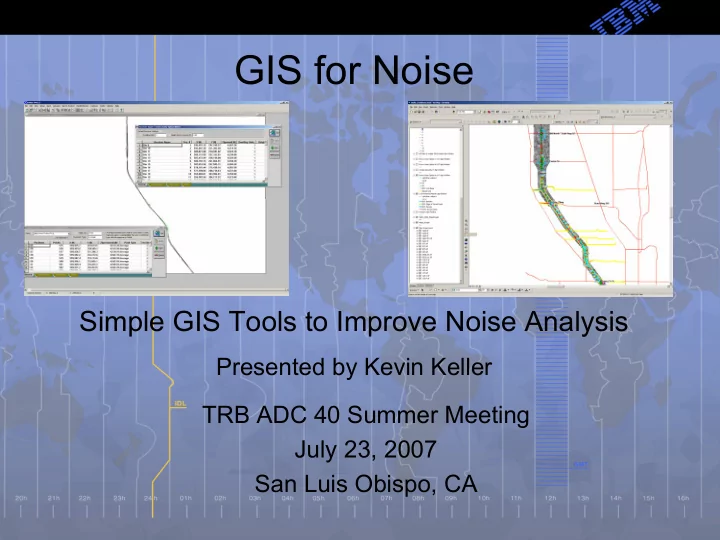
GIS for Noise Simple GIS Tools to Improve Noise Analysis Presented by Kevin Keller TRB ADC 40 Summer Meeting July 23, 2007 San Luis Obispo, CA GIS Geographic Information System Geographic Related to the surface of the earth
– Use to plan field work, placement of model sites, address and building information
– Use to plan field work, placement of model sites, measuring distance, graphics
– Use to build 3d surface of project area, which is used to calculated elevations of roadways, receivers, and barriers.
Impact Metric = (#Res. Population Impacts/Mile) + (0.3 x(#MU Population Impacts/Mile)) + ((100 X # Hospitals)/Mile) + (250 x # Schools)/Mile)